I’ve written before about struggling to learn Azure Synapse, and I’ve struggled as well with getting excited about Microsoft Fabric. I think the pitch and the potential of Microsoft Fabric is real. The issue is that it solves problems I don’t have. In my work, I don’t deal with data so big that Power BI can’t handle it. I don’t deal with data so unstructured that Power Query can’t handle it.
But I know I need to learn Fabric. Power BI is a part of Fabric, the integrations are only going to continue to improve. If nothing else, I need to be able to tell customers if they should look into using Fabric or not. So what do you do when there is a technology you aren’t excited about, but have to learn?
One solution is to get certified. In the past, I’ve written about how I find certs to be useful learning paths and something concrete to focus on. Last week they announced the DP-600 certification which looks promising for that. Another option is to take on a work project that is a bit of a stretch and then learn on the job. As a consultant, that’s always a bit of a catch-22 because you are selling yourself based on expertise you theoretically already have. The last option is to create a homelab and a side project.
The challenge, though, is what do you put up there for a homelab? A lot of publicly available data is boring, purely descriptive, and/or already cleaned. For simple descriptive reporting, that’s perfectly fine. But for Fabric you want big data, ugly data, changing data. In comes the Magic the Gathering card game and a little data tracking project called 17lands.
Magic the Gathering and its big data revolution
Magic the Gathering, if you don’t know, is a competitive trading card game. With the rise of its online client, MTG Arena, it’s been going through a similar revolution like baseball and Sabermetrics (or so I assume, I’m not a sports guy). Now, instead of speculating which cards from a new set are the best, it’s possible to track in that in real-time thanks to a project called 17lands which collects data from players who opt in.
This has allowed for fascinating analysis. Even if you don’t play, I recommend checking out this video below. It’s fascinating to see how the “metagame” of a format evolves over time as people realize which cards are good and which cards are bad. It also allows for a lot of amateur analysis, for good and for bad. Then every 4 months it happens all over again with a new release.
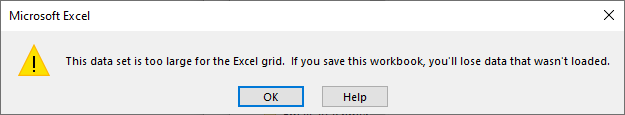
This data seems ideal for a few reasons, first the raw data is big but manageable. A single “season” is 10 GB uncompressed, and 0.25 GB compressed. I did learn that Excel will try its best to open 10GB file, yell at you about too many rows, and then show you’re the first million. The 40x compression also suggests that the data is very denormalized and would benefit from some normalization.
The second reason is that the schema is a mess. The data has over 600 columns, many of which are numerical flags for each individual possible card, which changes from season to season. Trying to manage this in Power Query is theoretically doable but likely very frustrating.
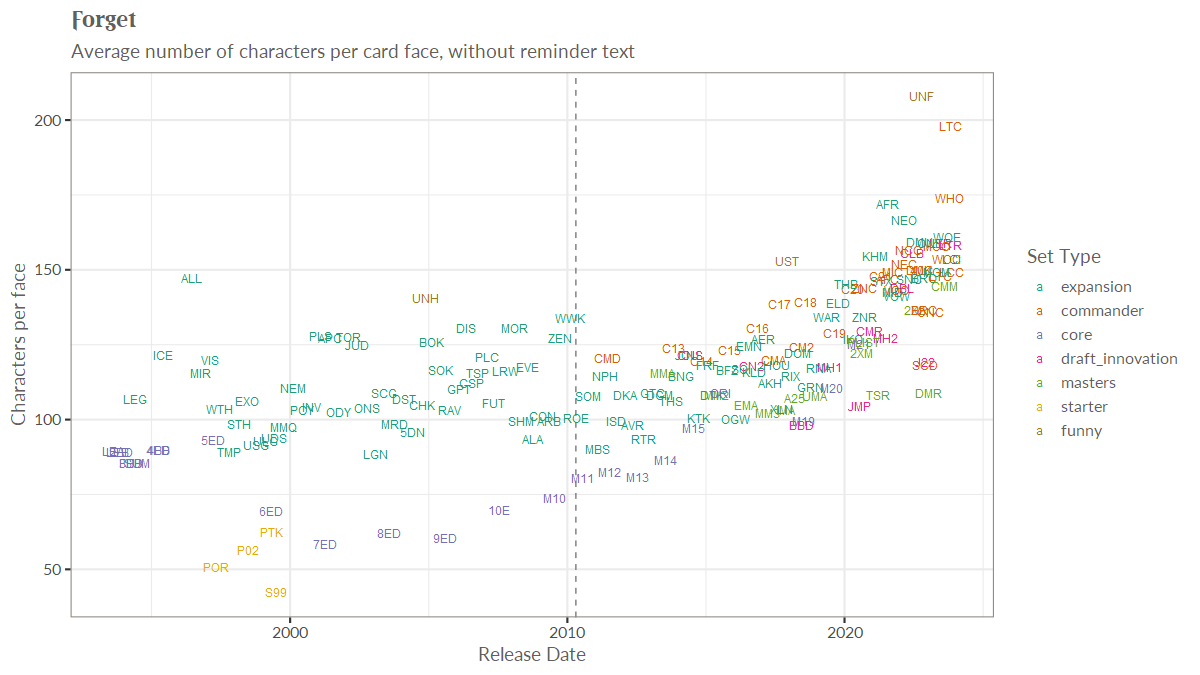
Finally, it’s something I’m interested in. MTG_ds on Twitter is constantly posting graphics like this (increasing wordiness of cards each release), with insights hiding behind the high level numbers.
There are actually questions that people are interested in, that aren’t easy to answer. I like to make replayable subsets of cards called “cubes“, so being able to do things like mathematically optimizing based on cost and fun are interesting to me.
Calling my shot
I think with this sort of thing, it’s important to document your expectation and pain points, because you only get to be a newbie once. I’ll try to write down my expectations ahead of time so we can see where I’m wrong.
From what I’ve seen so far, I expect the learning path at learn.microsoft.com to be very helpful in getting oriented. I expect a lot of content online to be frustrating, because so much of it assumes you have a data lake and know what you are doing.
Speaking of which, my background is as a former DBA and now Power BI consultant. I’ve never touched ADF, data lakes, or ML in and professional capacity. As the title says, I’m going to be winging it. What I do have, however, is experience having to learn a new technology in 2-3 months (see the course below) and experience breaking down big BI projects into smaller chunks.
I hope you enjoy watching the ride and let me know if there’s anything specific you’d like me to include.
Leave a Reply