Last week, I struggled to load the data into Fabric, but finally got it into a Lakehouse. I was starting to run into a lot of frustration, and so it seemed like a good time to back up and get more oriented about the different pieces of Fabric and how they fit together. In my experience, it’s often most effective to try to do something, review some learning, and alternate. Without a particular pain point, it’s hard for the information to stick.
As an aside, I wish there was more training content that focused on orienting learners. In her book, Design for How People Learn, Julie Dirksen uses the closet analogy for memory and learning. Imagine someone asks you to put away a winter hat. Does that go with the other hats? Does it go with the other winter clothes? An instructor’s job is to provide boxes and labels for where knowledge should go.
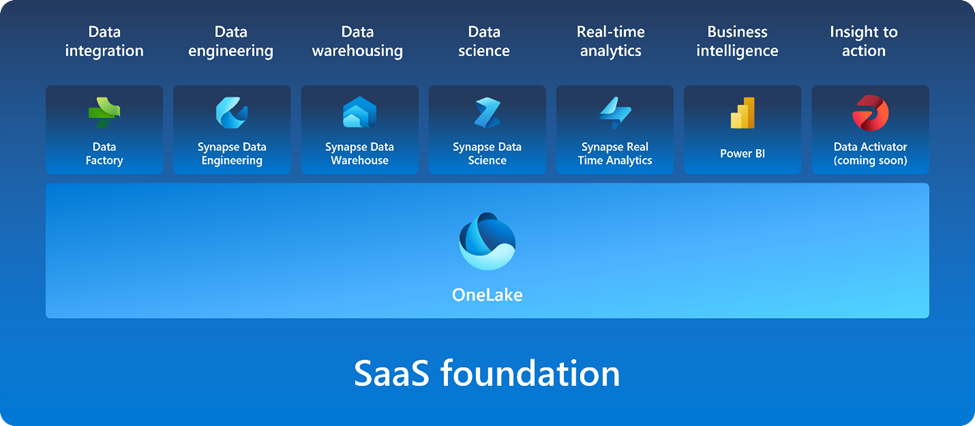
Orienting training content says “Here are the boxes, here are the labels”. So if I learn Fabric supports Spark, should I put that in the big data box, the compute engine box, the delta lake box, or something else entirely? If you are posting the Microsoft graphic below without additional context, you are doing folks a disservice, because it would be like laying out your whole wardrobe on the floor and then asking someone to put it away.
Getting oriented
So, to get oriented, first I watched Learning Microsoft Fabric: A Data Analytics and Engineering Preview by Helen Wall and Gini von Courter on LinkedIn Learning. It was slightly more introductory than I would have liked, but did a good job of explaining how many of the pieces fit together.
Next, I starting going through the Microsoft learning path and cloud skills challenge. Some of the initial content was more marketing and fluffy than I would have preferred. For example, explanations of the tools used words from the tool name and then fluff like “industry-leading”. This wouldn’t have helped me at all with my previous issue last week of understanding what data warehousing means in this context.
After some of the fluff, however, Microsoft has very well written exercises. They are detailed, easy to follow, and include technical tidbits along the way. I think the biggest possible improvement would be to have links to more in-depth information and guidance. For example, when the Lakehouse lab mentions the Parquet file format, I’d love for that to have a link explaining Parquet, or at least how it fits into the Microsoft ecosystem.
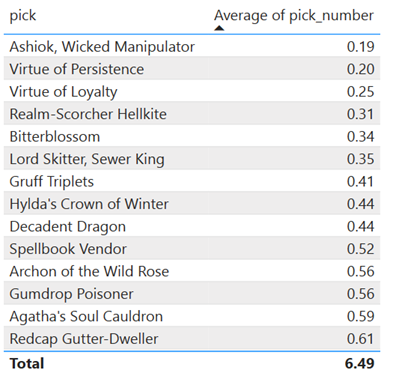
Trying it with the MTG data
Feeling more comfortable with how Lakehouse works, I try to load the CSV to a lakehouse table and I immediately run into an error.
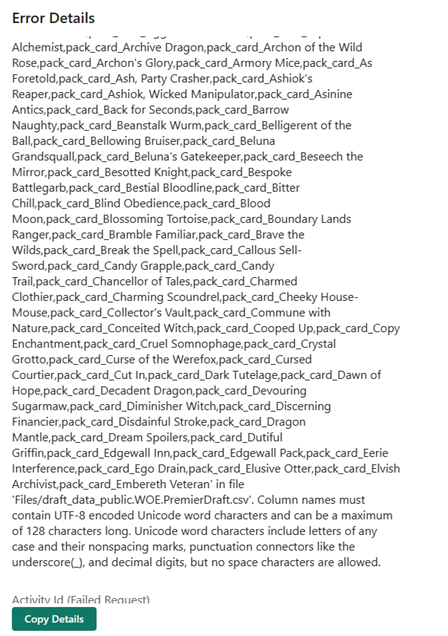
It turns out that it doesn’t allow for spaces in column names. It would be nice if it provided me with an option to automatically rename the columns, but alas. So next I try to use a dataflow to transform the CSV into a suitable shape. I try loading files from OneLake data hub, and at first I assume I’m out of luck, because I don’t see my file. I assume this only shows processed parquet files, because I can see the sales table I made in the MS Learn lab.
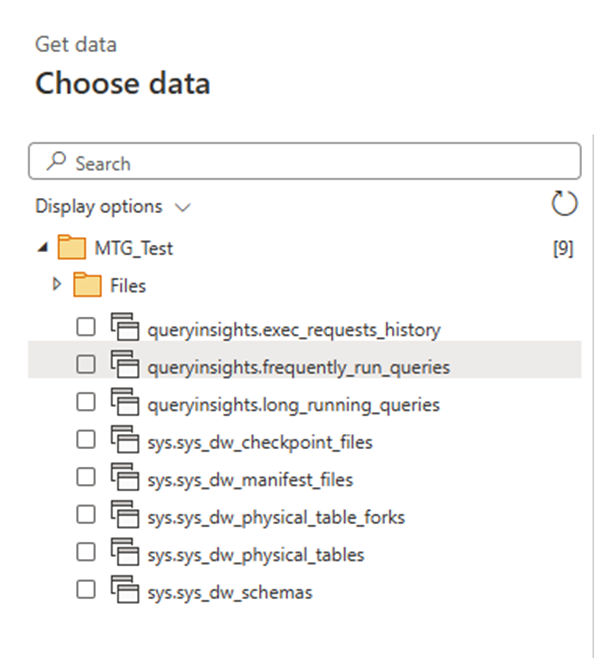
It takes a few tries and some digging to notice the little arrow by the files and realize it’s a subfolder and not the name of the folder I’m in. This hybrid files and tables and SQL Endpoints thing is going to take some getting used to.
I create a dataflow based on the file, remove all but the first few columns and select publish. It seems to work for a while, and then I get an error:
MashupException.Error: Expression.Error: Failed to insert a table., InnerException: We cannot convert a value of type Table to type Text.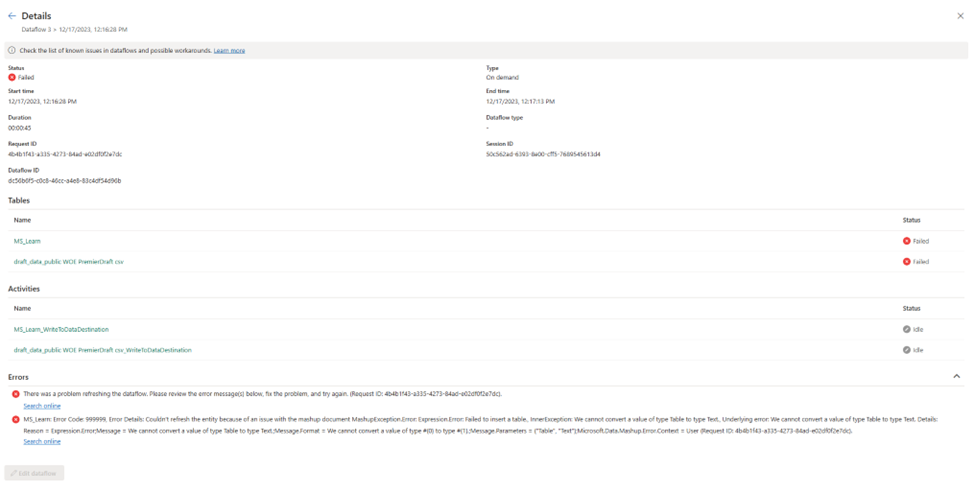
This seems…bizarre. I got back and check my data and it looks like plain CSV file, no nested data types or anything weird. Now I do see table data types as part of the navigation steps, but none of the previews for any of the steps show any errors. I hit publish again, and it spins for a long time. I assume this means it’s refreshing, but I honestly can’t tell. I go to the workspace list and manually click refresh.
I get the same error as before, and I’m not entirely sure how to solve it. In Power BI Desktop, I’m used to being taken to what line is producing the error.
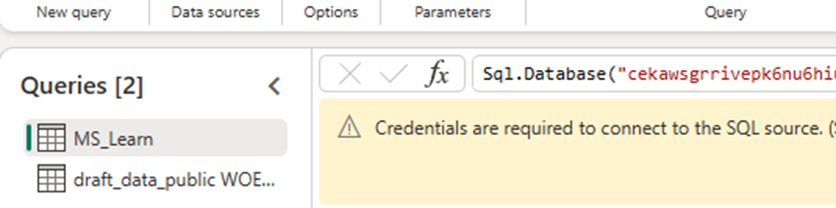
It turns out that I also had a failed SQL connection from a different workspace in the same dataflow. How I caused that or created it, I have no idea. The original error message did include the name of the query, but because I had called it MS_learn, I thought the error was pointing me to a specific article.
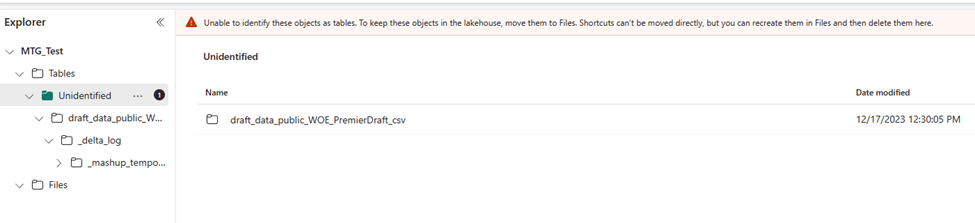
It takes about 15 minutes to run, then the new file shows up under…tables in a subfolder called unidentified. I get a warning that I should move these over to files. It’s at this point I’m very confused about what is happening and what I am doing.
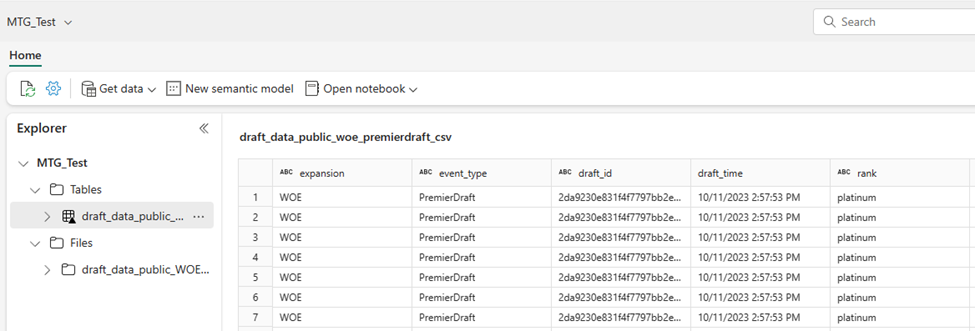
So, I move it to files, and then select load to tables. Do that seems to work, although I’m mildly concerned that I might have deleted the original CSV file with my dataflow because I don’t see it anymore.
Additionally, I notice that I have been doing this all in My Workspace, which isn’t ideal, but that when I create a semantic model, it doesn’t let me create it there. So I have to create it in my Fabric Test workspace instead.
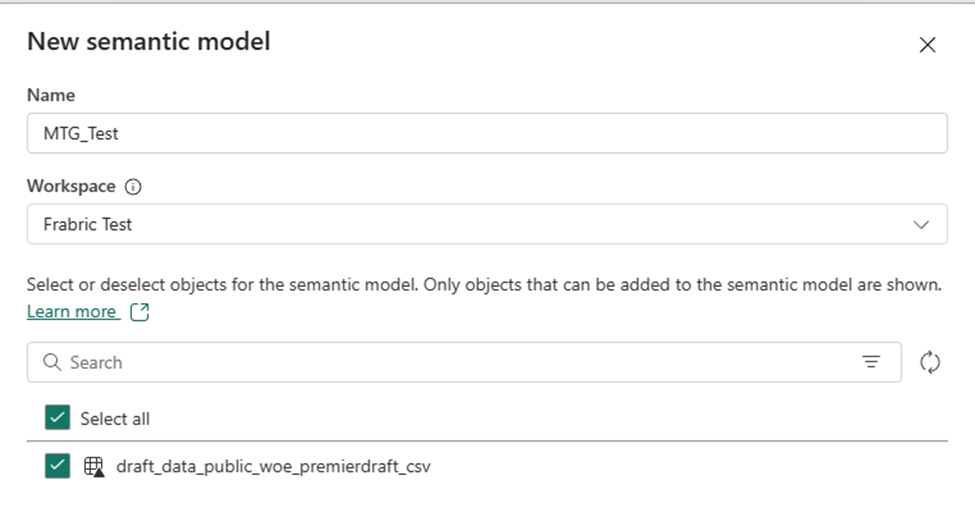
Regardless, I’m able to create a semantic model and start creating a report. Overall, this is promising.
Summary
So far, it feels a lot like there is a lot of potential with Fabric, but if you fall off the ideal path, it can be challenging to get back onto it. I’m impressed with the amount of visual tools available, this seems to be underappreciated when people talk about Fabric. It’s clearly designed to put Power BI users at ease and make the learning experience better.
I’m still unclear when I’m supposed to put the data into a warehouse instead of this current workflow, and I’m still unclear what the proper way is to clean up my data or deal with issues like this.
Leave a Reply