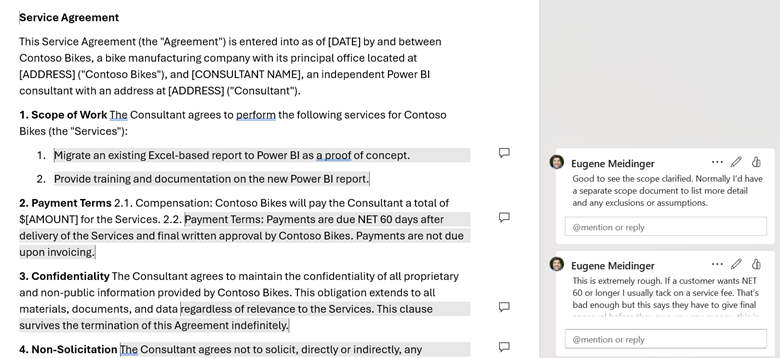
Recently there was a well-intended blog post that had a poorly worded title. The title suggested that Power BI modeling experts can be replaced with AI and the Power BI MCP server. The author acknowledged that the title was more inflammatory than intended, so this isn’t about that. At the core, he had some very good points.
What this is about is what words like expertise mean and what is going to happen to the market for consultants and experts. In my opinion, LLMs can replace much of what I do, because much of my consulting is not true expertise as people think of it.
LLMs can’t properly replace experts but in some cases they are going to anyway.
Bloom’s taxonomy of learning
So what the heck is “expertise”? I learned early on in consulting that expertise is often relative. In my first consulting job, I was doing a SQL server health check. I didn’t really know what I was doing, I had been an accidental DBA for 3 years. But I discovered the customer was doing full 20 GB backups every 30 minutes and a transaction log backup at night. I didn’t know much but I knew that was wrong and I looked like a hero when I provided a fix.
One way of thinking about expertise is Bloom’s taxonomy of learning. It is a pyramid of different depths of learning and understanding. When I think about instructional design, I think about a condensed form: Remember, Understand, Apply, Analyze. So, let’s use the example of a lakehouse to explain it.
Remember is rote memorization. If I ask you what data store allows you to upload CSV files from the browser and convert them to delta tables, you can tell me it’s a lakehouse. Do you have any idea what that means? Probably not.
Understand means you know enough to have a sense of what those words mean and how it might compare to a Fabric warehouse. Apply means you can actually set up a lakehouse and do that upload. Analyze means you can make an informed choice about your needs and choose the right data store.
Experts earn their pay at the highest level, analyze, but very often they are doing work at all levels of the pyramid. And customers often don’t need help at that highest level. This is going to have impacts on the marketplace.
Expert as search engine
Half of the time when I answer technical questions on Reddit, I just look up docs that I know exist and post them with a single sentence comment. Many times when I answer customer questions for Fabric, it’s a matter of answering “Is there a way to do x?”. For example a recent one was “How can you show all of the timestamps for the delta logs”. For lakehouses, I knew off the top of my head they could use “DESCRIBE HISTORY”. This is basically the “remember level” of learning.
I would say today that top-tier LLM with extended thinking and backed by a good search engine can often do this as well as I can or better in most cases. That said, even though I’m acting as a glorified search engine, customers are often paying for the reliability of my answers as well.
Sometimes, I need to be able to explain how these things work under the hood and that’s a lot closer to “understand”. LLMs can do some of this work but will also happily hallucinate things. You can avoid some of that by demanding it provide sources, but it’s not always successful. Google Gemini, in my experience, is particularly stubborn about thinking it knows the correct answer.
Expert as hired hands
There is a pretty wide spectrum from employee to contractor to consultant to advisor/architect. And that spectrum is a matter of whether you are doing hands work or head work. This also typically comes with a price increase and fewer hours of work.
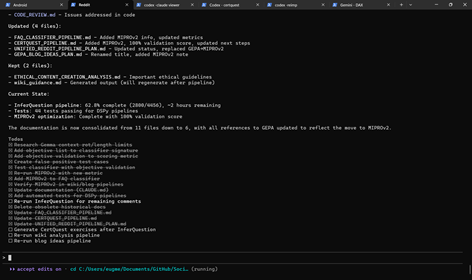
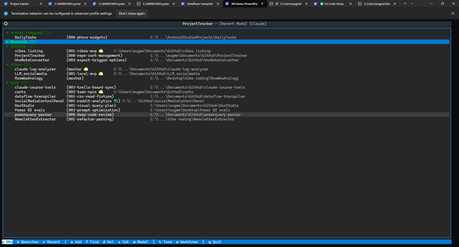
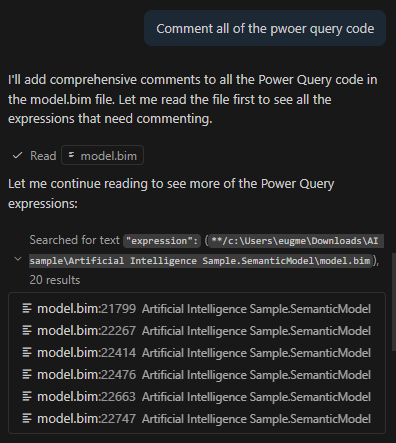
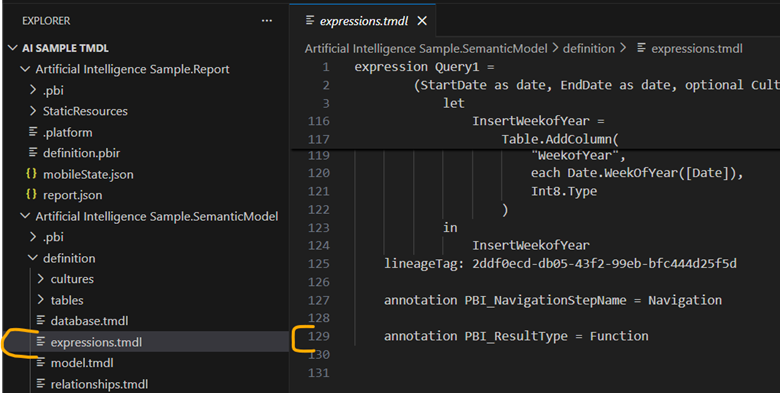
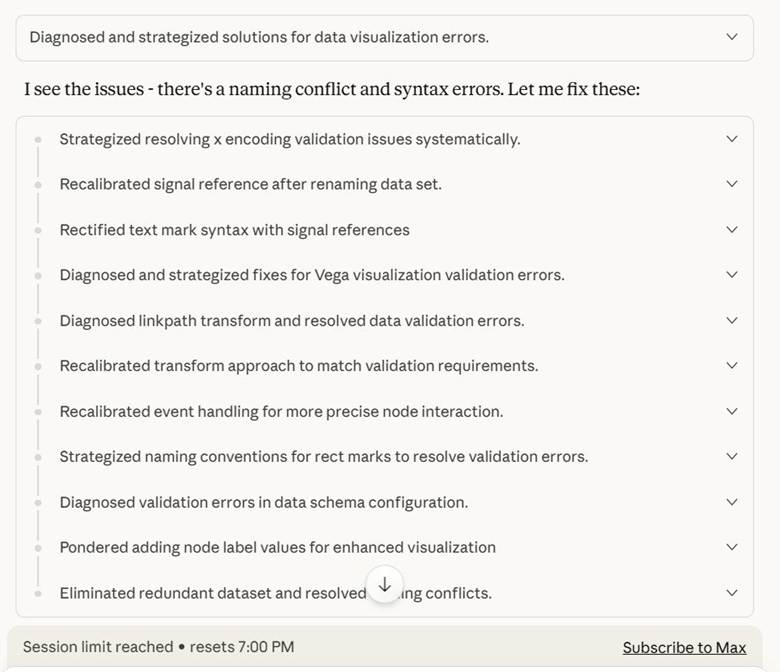
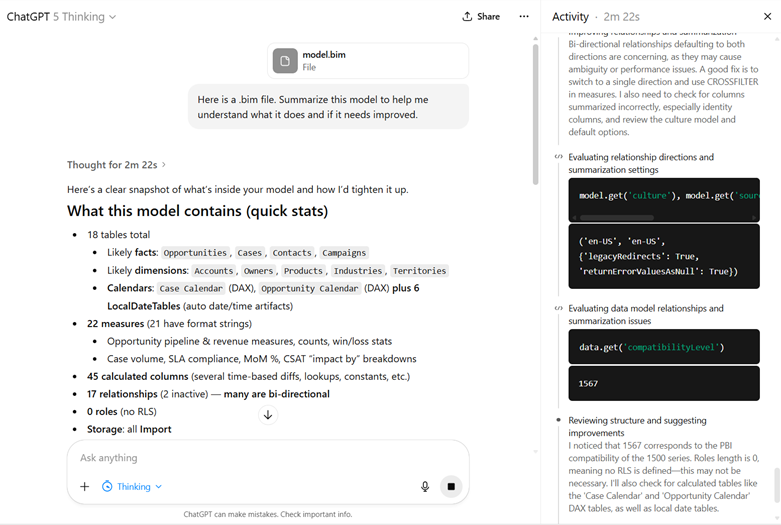
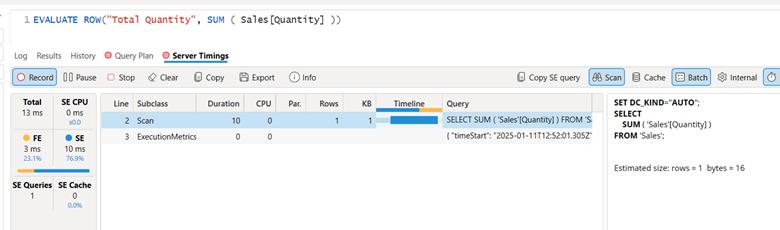
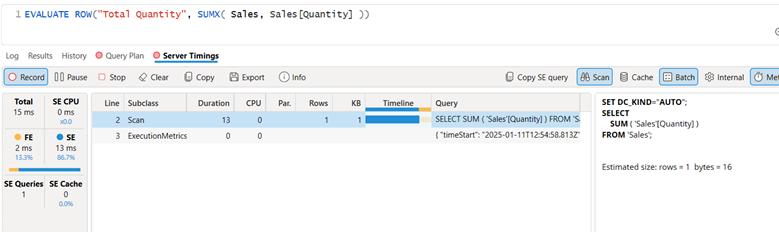
That said, plenty of times I am also hired to do stuff. This corresponds to the “understand” and “apply” levels of the work. While I would not trust LLMs to do a lot of this, sometimes it can do work with tools like the Power BI modeling MCP. The core issue as always is how do you validate the work. LLMs are quite happy to write slop. Either humans or automated tests need to be there to validate the work.
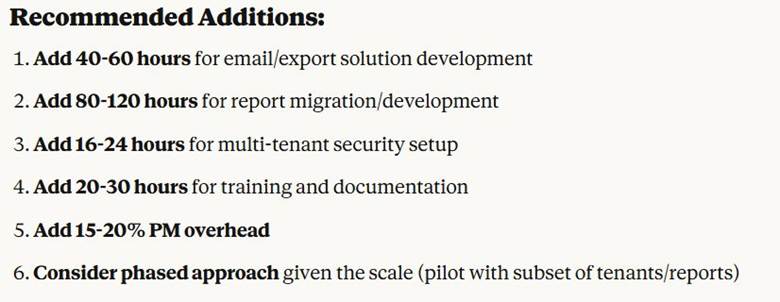
The bigger risk for consultants is the fact that many customers have the skills and capacity to do the work, they just don’t have the knowledge and direction. We now live in a world where you might provide a customer with a quote and a scope of work. Then they ask Claude to turn that into instructions and they do the work themselves. For simple work, the instructions will be half-decent and good enough.
Expert as data therapist
A more interesting aspect of what I do is as therapist for people’s data. Often times, customers have all the skills to implement the work. What they need help with is thinking out loud to understand their problem. They need to do rubber duck development. I’ve often thought LLMs as a rubber duck that talks back to you. This can be a wonderful, wonderful service.
On the other hand, customers need someone to ask them the right questions to help them crystallize their thinking and specify under specified things. What LLMs are not good at is interviewing the user, asking the right questions, and not taking what the user wants at face value.
If a user asks how to provide access to data from one workspace to another, it will happily answer that. What it will not do is ask why you need to do that. And then when the customer says for security, ask what needs are driving that.
Critically analyzing user requests and requirements is one of the most important things I can do.
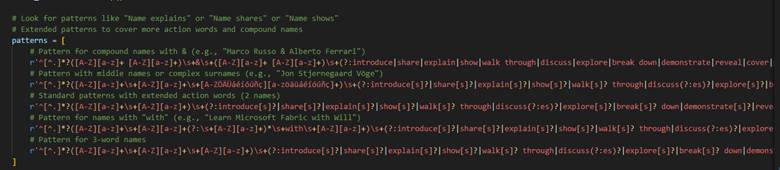
Experts as pushback
But it goes even further than that. Not only are LLMs sycophants and yes-men, but they are master improvisers. They will “yes, and…” their way through many questions. If you ask an LLM how to convert developer story points into marketing impressions, many will try!
In fact, Peter Gostev made a Bullshit Benchmark that specifically tests that. Claude models are the best at pushing back, most others are very bad at it.
I’ve heard it said that the way a senior developer earns their pay is not by being more productive, but by all of the wasted work and false starts they avoided. BI experts are the same. A great consultant is worth it for all of the solutions they didn’t provide or recommend.
Summary
Can LLMs replace experts? Overall, no. The core value of experts, asking the right questions and pushing back on the wrong answers, remains as valuable as ever.
Can they replace a lot of what experts are hired for? Yes. Very, very much yes. The aggregate demand for consultants and experts is going to drop as a result.
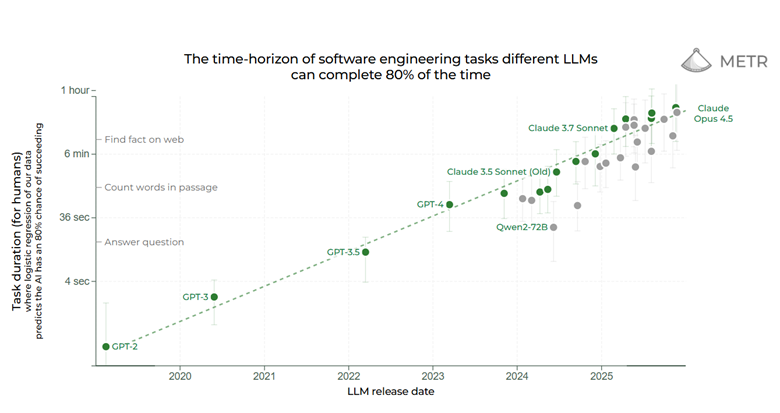
Would I recommend someone become a Power BI or Fabric consultant in 2026. No, no way in heck. As I’ve written recently, the job market is going to get bumpy. Eventually it will reach a new equilibrium.