Monthly Archives: December 2023

Lessons learned from being self-employed: 5 years in

Content warning: burnout, health issues

I have not been looking forward to writing this blog post. I started the series, inspired by Brent Ozar’s series, because being able to see how the other side lived helped me to evaluate the risks and take the leap to work for myself. Unfortunately, that commitment means writing about one of the worst years of my career, and what has felt largely like a waste.

A health scare

2023 started off in a state of burnout, techniques for recovery that worked in the past had stopped working. I was forced to try taking 2 consecutive weeks off for the first time in my career, and it helped dramatically. Also, during this time I was panicking about the change in payments from Pluralsight, and I reached out to everyone I could think of who sold courses or had a big YouTube channel for advice. Thank you to everyone who spent the time to help.

As a result I had decided I was going to start selling my own, self-hosted courses. I think I had hoped that I could just ramp up the social media a smidge, ramp down the consulting a smidge, and make it all work. If I could go back in time, I would have cut down on all extraneous commitments and focused just on this. Instead, I tried to make it all work, because of what I thought I “should” be able to accomplish, or what I had been able to accomplish in years past.

Around this same time, Meagan Longoria (along with others) convinced me at SQLBits to raise my consulting rates by 30%. Meagan has the tendency to be painfully blunt, while also being kind and empathetic. I think it’s difficult to nail both candor and kindness at the same time.

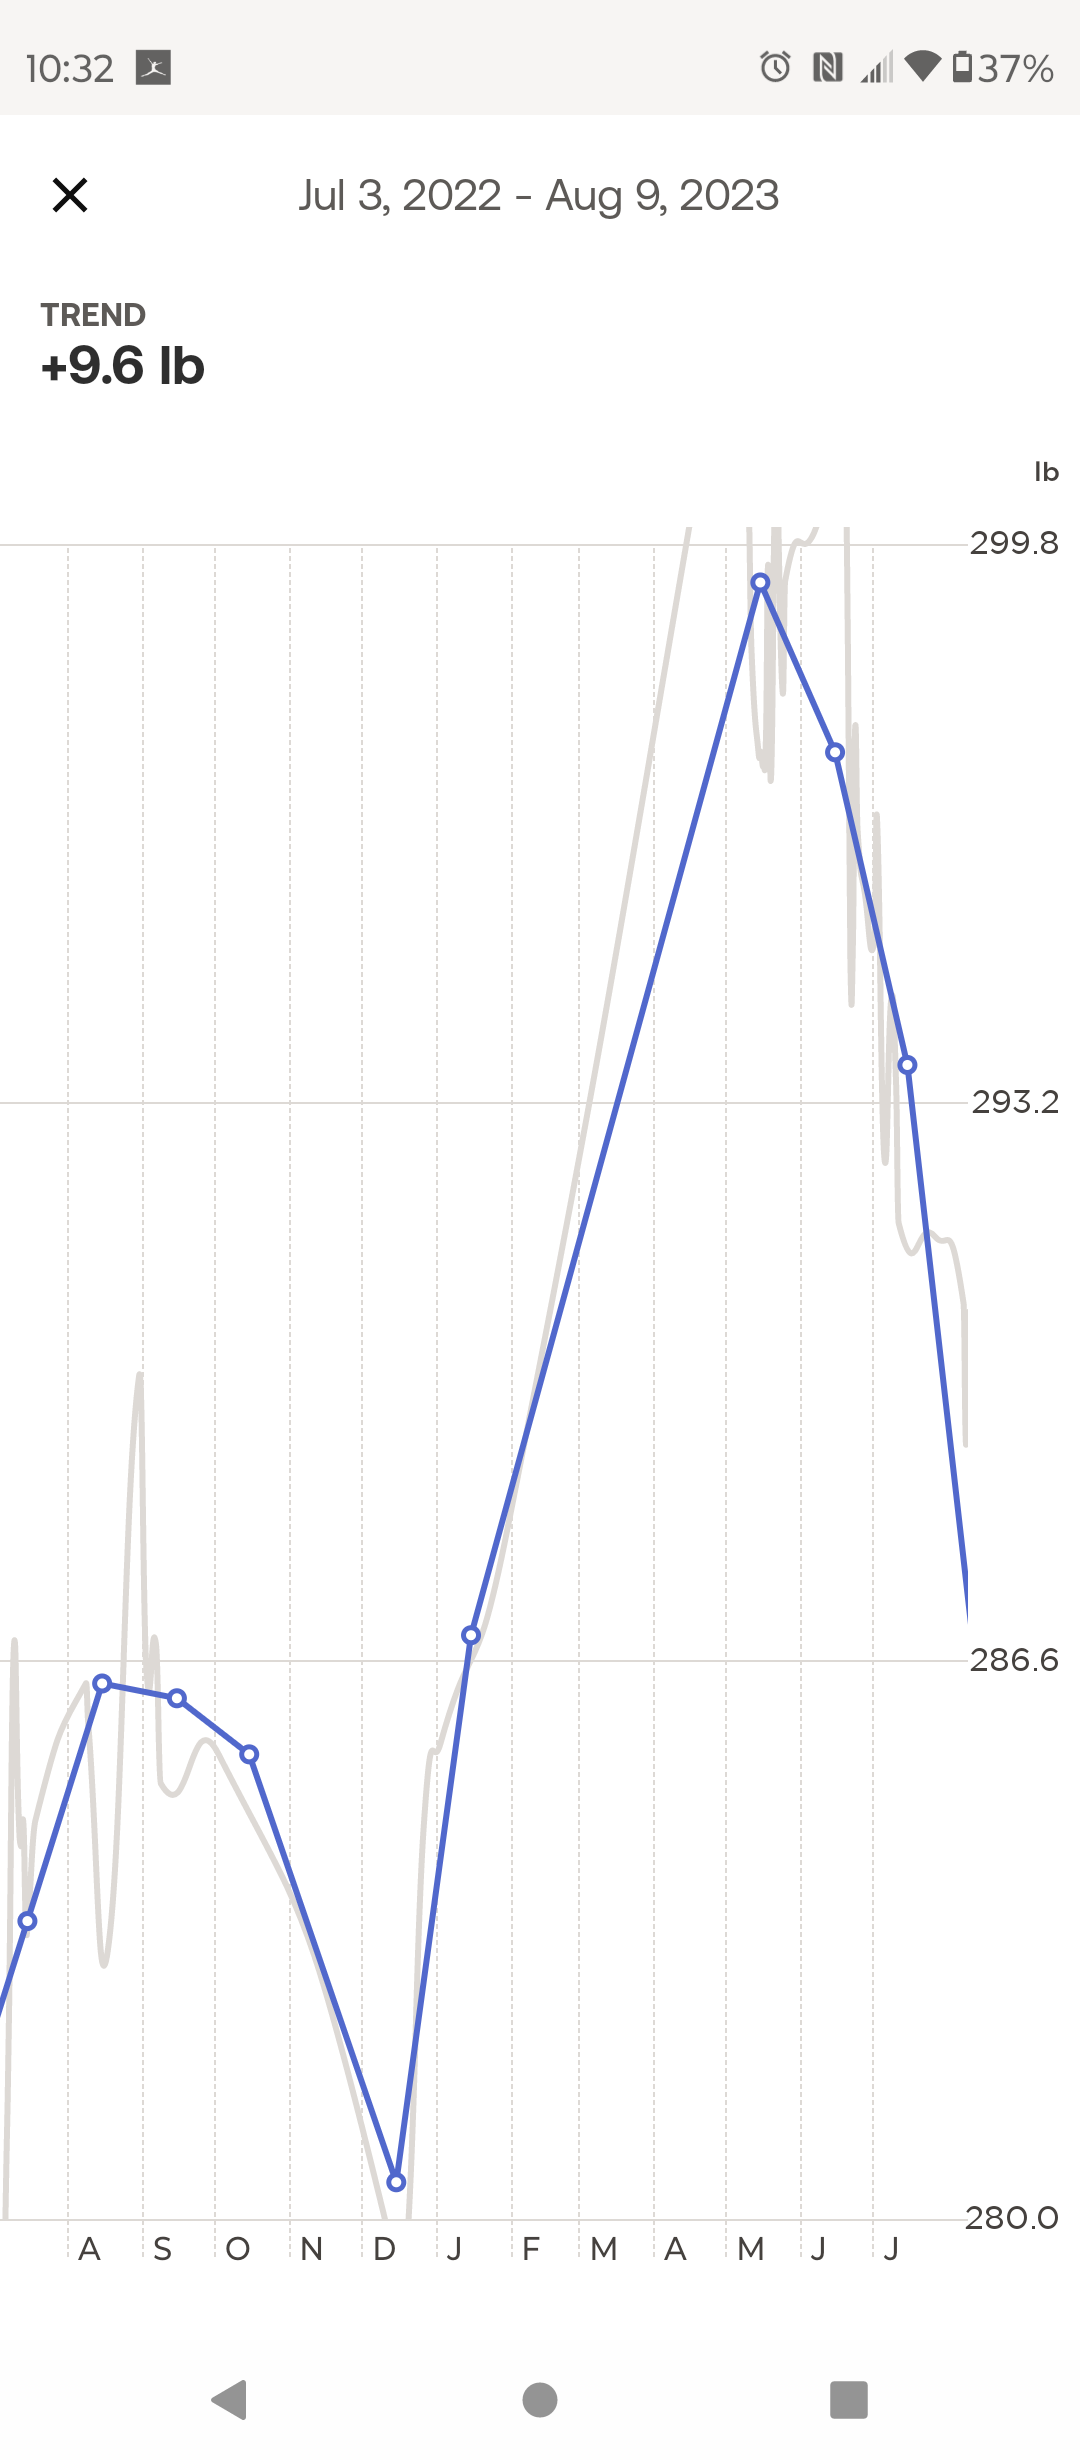
The health scare came in March, when I started weighing myself again. Travel from Bits and work had caused me to fall out of habit with exercising. What I found was I was the heaviest I had been in my entire life at 300 lbs. Even heavier than when I was in college and considered myself fairly obese. I had gained 20 lbs in 3 months, which as a diabetic is very very bad.

Barreling towards burnout

I decided I needed to do something, so I bribed myself with a Magic the Gathering booster every morning I exercised, and a Steam Deck if I could do that daily for 3 consecutive months. Overall, that worked, but I did find that in my mid 30s, it’s hard to just push through like that. I have to be careful, or I’ll develop plantar fasciitis or some other issues for a while.

At the same time, however, my work requirements had picked up. I had signed up for a volunteer position with a local organization that had become very stressful. I had work projects that had dragged on longer than they should and were starting to frustrate my customers. And I had found that the branding and marketing of selling my own courses involved much much more work and executive function than I had realized.

I did end up contracting and then hiring part time a local college grad to be my marketing assistant. She was recommended via a close professor friend of mine and overall she has been great. The biggest challenge has been acclimating someone to our particular niche of the data space and what the community is like.

Around June, I realized I was simply spread too thin. I had experienced being physically unable to get out of bed any sooner than was physically necessary. I was physically unable to get up an hour early for work to try to push through a project or deadline. I was should-ing myself to death, taking on more than I could handle because I thought I should be able to do more, because I thought people would be disappointed in me if I had to close out projects and work.

Ultimately, the largest threat to my health and well-being was my own personal pride.

Turning the corner

Thankfully I did decide to wind down as much of my consulting work as I could. It took multiple months longer than I would have preferred, honestly. I closed out any open projects that I could easily do so, and now I’m down to 2 customers that are a few hours per week. I also decided that I wouldn’t take on any new projects during November or December.

I’ve also been focusing on making that course and I officially have given myself a hard deadline of February 5th. At the moment I have absolutely no idea how well it will do. If it does well, that means I can continue to focus on making training content for a living. If not, I’ll have to consider pivoting into more of a focus on consulting or going back to a regular job. I would have preferred to be releasing this in the summer of 2023, but here we are.

I think the hardest thing to grapple with regarding burnout, is the uncertainty of how long it will take to recover and how aggressive you have to be in resting to recover. I’m grateful to both Matthew Roche and Cathrine Wilhelmsen for putting that into perspective.

There are days that I feel much better, I feel energetic and enthusiastic. Coming back from PASS Summit, I felt that way all week. But at the moment it’s still fragile, and I have to remind myself that a good day in a week doesn’t mean the issue has been totally solved yet.

One other thing, I always struggle with the lack of sunlight in the winter. For the first time ever, I’m being proactive about it and going somewhere warm in December instead of January or February when the issue becomes apparent. So, I’ll be spending Christmas week in San Juan, Puerto Rico where it is currently 80 degrees Fahrenheit. See y’all on the other side of 2024.

Fabric Ridealong Week 3 – Trying to put it into a table

Last week, I struggled to load the data into Fabric, but finally got it into a Lakehouse. I was starting to run into a lot of frustration, and so it seemed like a good time to back up and get more oriented about the different pieces of Fabric and how they fit together. In my experience, it’s often most effective to try to do something, review some learning, and alternate. Without a particular pain point, it’s hard for the information to stick.

As an aside, I wish there was more training content that focused on orienting learners. In her book, Design for How People Learn, Julie Dirksen uses the closet analogy for memory and learning. Imagine someone asks you to put away a winter hat. Does that go with the other hats? Does it go with the other winter clothes? An instructor’s job is to provide boxes and labels for where knowledge should go.

Orienting training content says “Here are the boxes, here are the labels”. So if I learn Fabric supports Spark, should I put that in the big data box, the compute engine box, the delta lake box, or something else entirely? If you are posting the Microsoft graphic below without additional context, you are doing folks a disservice, because it would be like laying out your whole wardrobe on the floor and then asking someone to put it away.

Getting oriented

So, to get oriented, first I watched Learning Microsoft Fabric: A Data Analytics and Engineering Preview by Helen Wall and Gini von Courter on LinkedIn Learning. It was slightly more introductory than I would have liked, but did a good job of explaining how many of the pieces fit together.

Next, I starting going through the Microsoft learning path and cloud skills challenge. Some of the initial content was more marketing and fluffy than I would have preferred. For example, explanations of the tools used words from the tool name and then fluff like “industry-leading”.  This wouldn’t have helped me at all with my previous issue last week of understanding what data warehousing means in this context.

After some of the fluff, however, Microsoft has very well written exercises. They are detailed, easy to follow, and include technical tidbits along the way. I think the biggest possible improvement would be to have links to more in-depth information and guidance. For example, when the Lakehouse lab mentions the Parquet file format, I’d love for that to have a link explaining Parquet, or at least how it fits into the Microsoft ecosystem.

Trying it with the MTG data

Feeling more comfortable with how Lakehouse works, I try to load the CSV to a lakehouse table and I immediately run into an error.

It turns out that it doesn’t allow for spaces in column names. It would be nice if it provided me with an option to automatically rename the columns, but alas. So next I try to use a dataflow to transform the CSV into a suitable shape. I try loading files from OneLake data hub, and at first I assume I’m out of luck, because I don’t see my file. I assume this only shows processed parquet files, because I can see the sales table I made in the MS Learn lab.

It takes a few tries and some digging to notice the little arrow by the files and realize it’s a subfolder and not the name of the folder I’m in. This hybrid files and tables and SQL Endpoints thing is going to take some getting used to.

I create a dataflow based on the file, remove all but the first few columns and select publish. It seems to work for a while, and then I get an error:

MashupException.Error: Expression.Error: Failed to insert a table., InnerException: We cannot convert a value of type Table to type Text.

This seems…bizarre. I got back and check my data and it looks like plain CSV file, no nested data types or anything weird. Now I do see table data types as part of the navigation steps, but none of the previews for any of the steps show any errors. I hit publish again, and it spins for a long time. I assume this means it’s refreshing, but I honestly can’t tell. I go to the workspace list and manually click refresh.

I get the same error as before, and I’m not entirely sure how to solve it. In Power BI Desktop, I’m used to being taken to what line is producing the error.

It turns out that I also had a failed SQL connection from a different workspace in the same dataflow. How I caused that or created it, I have no idea. The original error message did include the name of the query, but because I had called it MS_learn, I thought the error was pointing me to a specific article.

It takes about 15 minutes to run, then the new file shows up under…tables in a subfolder called unidentified. I get a warning that I should move these over to files. It’s at this point I’m very confused about what is happening and what I am doing.

So, I move it to files, and then select load to tables. Do that seems to work, although I’m mildly concerned that I might have deleted the original CSV file with my dataflow because I don’t see it anymore.

Additionally, I notice that I have been doing this all in My Workspace, which isn’t ideal, but that when I create a semantic model, it doesn’t let me create it there. So I have to create it in my Fabric Test workspace instead.

Regardless, I’m able to create a semantic model and start creating a report. Overall, this is promising.

Summary

So far, it feels a lot like there is a lot of potential with Fabric, but if you fall off the ideal path, it can be challenging to get back onto it. I’m impressed with the amount of visual tools available, this seems to be underappreciated when people talk about Fabric. It’s clearly designed to put Power BI users at ease and make the learning experience better.

I’m still unclear when I’m supposed to put the data into a warehouse instead of this current workflow, and I’m still unclear what the proper way is to clean up my data or deal with issues like this.

Fabric ridealong Week 2 – getting the data uploaded

I want to preface that a lot of the issues I run into below are because of my own ignorance around the tooling, and a lot of the detail I include is to show what that ignorance looks like, since many people reading this might be used to Fabric or at least data engineering.

So, last week we took a look at the data and saw that it was suitable for learning fabric. The next step is to upload it. Before we do anything else, we need to start a Fabric Trial. The process is very easy, although part of me would have expected it to show up on the main page and not just in the account menu. That said, I think the process is identical for Power BI.

Once I start the trial, more options show up on the main page. Fabric is really a collection of tools. I like that there are clear links at the bottom for the documentation and the community.

I think something that could be clearer is that the documentation includes tutorials and learning paths. While I understand that the docs.microsoft.com subdomain has been merged into the learn.microsoft.com subdomain, when I see “Read documentation” I assume that means stuffy reference material as opposed to anything hands on. This is an opportunity to take a lesson from Power BI Desktop by maybe having an introduction video, or at least having a “If you don’t know where to start, start here” link.

Ignoring all of that, the first I’m tempted to do is select one of these personas and see if I can upload my data. So, I take a guess and try Data Warehouse. Unfortunately, it turns out that this is more a targeted subset of the functionality. Essentially, as far as I would be aware, I’m still in Power BI. This risks a little bit of confusion, because the first 3 personas (Power BI, Data Factory, and Data Activator) are product names, so I’m likely to assume that the rest of them are also separate products. In part, because that’s how it historically has felt to me in Azure, as I’ve talked about when first learning Synapse.

Now thankfully, I’m aware that the goal of Fabric is to have more of a Power BI style experience, so I’m able to quickly orient myself and realize it is showing me a subset of functionality instead of a singular tool. I also see “?experience=data-warehouse” in the URL which is also a hint. So, I go ahead and click on the warehouse button, hoping this is what I need to upload my data. Unfortunately, I get a warning.

The warning says I need to upgrade to a free trial. But I just signed up for the free trial! Reading the description, I realize that I need to assign my personal workspace to the premium capacity provided by the free trial. This is a little confusing, and at first I had assumed I ran into a bug. I click upgrade and it works.

Finding where to put the data

Next it asks me for the name of my warehouse. I choose “MTG Test” and cross my fingers. Overall it seems to work. Again, I’m presented with some default buttons in the middle. I see options for dataflows and pipelines, and I assume those are intended for pulling data from an existing source, not uploading data. I also see an option for sample data, which I really appreciate for ease of learning.

I see Get Data in the top left, which I find comforting because it looks a lot like Get Data for Power BI, so let’s take a look. Unfortunately, it’s the same 2 buttons. So, we are at a bit of an impasse.

I click on the dataflow piece, but I’m starting to feel out of my depth. If my data already existed somewhere, I’d be fine, but it doesn’t. I have to figure out how to get the data into the data lake. So I back up a bit and then Bing “Fabric file upload”. The second option is documentation on “Options to get data into the Fabric Lakehouse”.

The first option shows how to do it in the lakehouse explorer. I go back to my warehouse explorer, looking for the tables folder, but it’s not there. I see a schemas folder, which I assume is maybe a rename like how they recently renamed datasets to semantic models. I assume that maybe schemas are different than tables and that I need to find a more detailed article on Lakehouse Explorer. It probably takes me a full minute to realize that a warehouse and a lakehouse are not the same thing, and that I’m probably in a different tool.

So, I backup again and search for the more specific query “fabric warehouse upload”. I see an article called “Tutorial: Ingest data into a Warehouse in Microsoft Fabric”. I quickly scan the article and see it suggesting using a pipeline to pull in data from blob storage. So I know that’s an option, but I’m under the vague impression that there should be a way to upload the data directly in the explorer.

Giving up and trying again

I dig around in Bing some more and I find another article called “Bring your data to OneLake with Lakehouse”. From demos I’ve seen of OneLake, it’s supposed to work kinda like One Drive. At this point I know I’m misunderstanding something about the distinction between a warehouse and a lakehouse, but I decide to just give up and try to upload data to a lakehouse. The naming requirements are more strict so I make MTG_Test.

I got to get data, I see the option to upload files. I upload a 10 gigabyte file and it works! Next week I’ll figure out how to do something with it.

Summary

Setting up the fabric trial was extremely easy and well documented. As far as I can tell, there’s a lot of getting started documentation for Fabric, but I wish it was surfaced or advertised a bit better. I run into a lot of frustration trying to just upload a file, in part because I don’t have a good understanding of the architecture and because my use case is a bit odd.

Overall, I’m feeling a bit disheartened, but I have to remind myself that I ran into a lot of the same frustrations learning Power BI. Some of that was the newness, some of that is learning anything, and some of that I expect the product team will smooth out over time.

I also acknowledge that I’d probably have an easier time if I just sat down and went through the learning paths and the tutorials. In practice though, a lot of times when I’m learning a new technology I like to see how quickly I can get my hands dirty, and then back up as necessary.