So, this week I gave my first presentation to
Ugh.
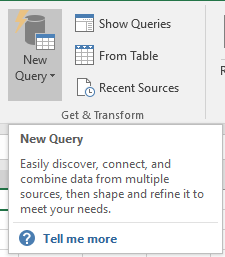
Power Query to the rescue
Normally this would be a giant pain to work with. When it comes to data quality, this is quite the
Excel is going to make some assumptions about what is part of the table. This is convenient for our needs, but we’ll have to find a work around when we want to scale to multiple excel files.


We can’t tell it we have headers, because it’s going to think that first row is a header. We’ll deal with that later. Once we click OK, we are taken to the Power Query / Power Pivot window.
I made a mistake
Hmm, so it looks like I made a mistake. I hope my honesty won’t lose me any
Trying again
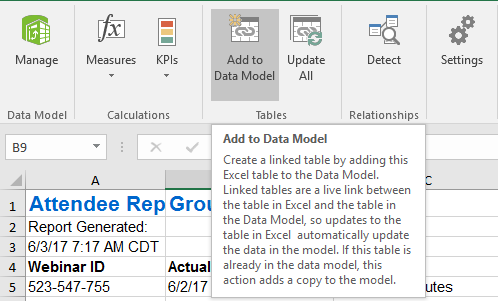
Let’s take a different approach. I’m going to open a blank excel workbook and pull the data into there. Okay, so let’s go to manage under the Power Pivot tab.

Next, we are going to click “Get External Data From Other Sources”

Then I’m going to scroll to the bottom and select Excel File.
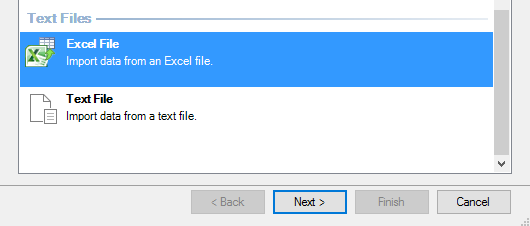
Once selected, I only have the whole first sheet as an option. If I had table objects or named ranges, that would be different.

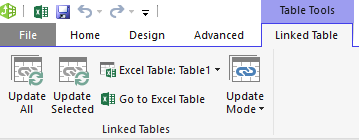
Hmmm, I still can’t find a way to edit the Power Query. Fiddlesticks!
Normally, in Power BI it would be right here:

Trying to do this in Excel is quite the
Okay, let’s try opening that Excel file. Ah, much better. Now I want to click Edit at the bottom right.

Cleaning the Data
So, First thing we need to do is get rid of all of the non-header rows at the top.

To do that, I just select Remove Rows –> Remove Top Rows.

Then I specify I want to get rid of the top 7 rows.

Next, I want to turn the actual header row into a header.

Okay, so now it looks like a real table.

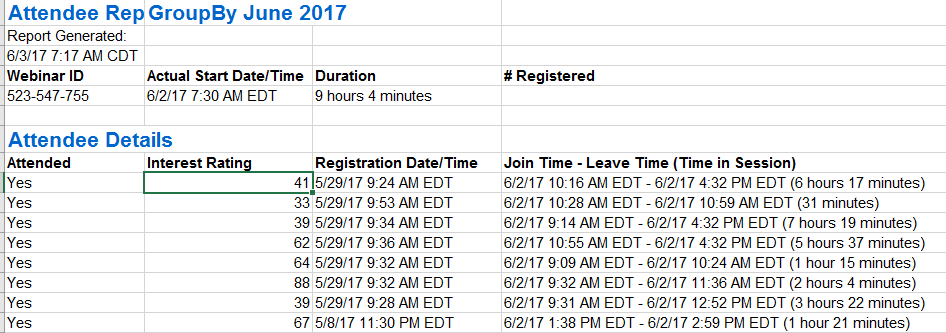
Comma Delimited BS
Okay, so now we need to parse out the times someone was watching. The problem is that some people were in and out. Their entries are comma delimited. Ugh.

Okay, let’s split them up. I’m going to select Split Column –> By Delimiter
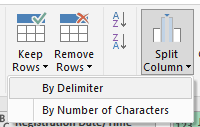
Unfortunately, splitting by column a) splits into more columns and b) you have to specify how many.

Thankfully, we can select those new columns and unpivot them.

Perfect. Now we have a row for every time a person as watching.

String parsing
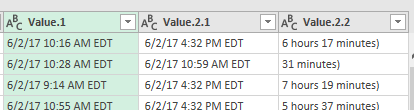
Okay, so now we just need to parse out the dates. First, we are going to split on the dash, and then the parenthesis.

This is starting to look good.
Now we just need to get rid of the timezone and convert it to a datetime. First we need to select Replace Values.


Lastly, we select the data type we want.

What’s next?
Now that are data is cleaned up, we’ll join to sessions table and do some simple data modeling. But that’s for the next blog post.