Query folding is one of the most powerful tools in Power Query and Power BI. It is the automatic process of pushing down filters and other transformations back to the data source. This can dramatically improve performance for your queries.
Unfortunately, OData is not guaranteed to support query folding. According to the Power BI documentation on incremental refresh.
Most data sources that support SQL queries support query folding. However, data sources like flat files, blobs, web, and OData feeds typically do not. In cases where the filter is not supported by the datasource back-end, it cannot be pushed down. In such cases, the mashup engine compensates and applies the filter locally, which may require retrieving the full dataset from the data source.
I recently did some tests on this for the OData source for Azure Devops. When I tested with the sample Northwind database, query folding was working. I was able to see with Fiddler that my date filter was getting pushed back down.
In this case, I was manually specifying the date filter in the URL. But it should be possible to use M code to dynamically generate the URL. Another option might be to create a custom data connector for oData that supports query folding.
Promotion: Use code PERFBLOG to save 10% off my course. Module 1 is free.
While it’s easy to make reports in Power BI, it can be a pain to troubleshoot and tune them. Properly performance tuning Power BI reports requires identifying the bottleneck and using a handful of external applications. This article covers how to narrow down the performance problem, as well as general best practices. Once you understand the fundamentals it gets a lot easier.
Which part is slow?
As a report developer, it can be frustrating a report developer, knowing that something is slow, but not being able to put your finger on it. In my mind, there are 4 main areas where there might be a slowdown:
Data refresh
Model calculations
Visualization rendering
Everything else
Identifying which one of these is the problem is the first step to improving performance. In most cases, if a report is slow it’s an issue with step 2, your data model.
Tuning the data refresh
The refresh is rarely the problem because the user never sees the refresh process if you are using Import mode. So usually you are going to see a slow refresh when you are authoring the report or if a scheduled refresh fails. Still, it’s important to tune your data refresh to avoid timeouts and minimize how much data your are loading.
Verify that query folding is working
If you are querying a relational database, especially SQL Server, then you want to make sure that query folding is being applied. Query folding is when M code in PowerQuery is pushed down to the source system, often via a SQL query. One simple way to confirm that query folding is working is to right click on a step sand select View Native Query. This will show you the SQL query that will be run against the database. If you have admin privileges on the server, you can also use extended events to monitor the server for queries. If you are doing this, you should limited the monitoring to the Data Mashup engine, which is the application name for Power Query.
Some transformation steps can break query folding, making any steps after them unfoldable. Finding out which steps break folding is a matter of trial and error. But simple transformations, such as filtering rows and removing columns, should be applied as early
Minimize the data you are loading
If you don’t need certain columns, then remove them. If you don’t need certain rows of data, then filter them out. This can improve performance when refreshing the data AND when modelling it later on, which is a win-win.
If your Power BI file is more than 100MB, there is a good chance you are going to see a slowdown due to the data size. Once it gets bigger than that it is important to either work on your DAX code, or look into an alternative querying/hosting method such as DirectQuery or Power BI Premium.
Consider performing joins in DAX, not in M
If you need to establish a relationship purely for filtering reasons, such as using a dimension table, then consider creating the relationship in DAX instead of in PowerQuery. DAX is blazing fast at applying filters, whereas Power Query can be very slow at applying a join, especially if that join is not being folded down to the SQL level. That being said, sometimes the data makes more sense as a flattened table for usability purposes.
Review your applied steps
Because Power Query is such a graphical tool, it can be easy to make changes and then forget about them. I had one customer who would often sort his data and then accidently leave the step in there. This was terrible for performance.
Make use of SQL indexes
If your data is in a relational database, then you want to make sure there are indexes to support your queries. If you are using just a few columns it may be possible to create a covering query that covers all of the columns you need. Work with your DBA to see what your options are. If you are using SQL Server, you can use execution plans to identify if the query is using an index. You will need the SHOW_PLAN permission on the server and you will need to use the View Native Query functionally to get the underlying SQL query
Tuning the model calculations
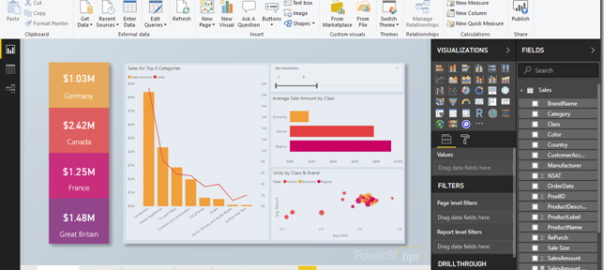
When someone says that a Power BI report is slow, it is usually an issue with the DAX modelling. Unfortunately, that fact isn’t obvious to the user and it can look like the visuals themselves are slow. Thankfully, there is a tool to identify the difference: the Power BI Performance Analyzer.
Use the Power BI Performance Analyzer
If your report is slow, the very first thing you should do is run the Power BI performance analyzer. This will give you detailed measurements of which visuals are slow as well as how much of that time is spent running DAX and how much is spent rendering the visual. Additionally, this tool gives you the actual DAX code being run behinds the scenes, which you can run manually with DAX Studio. When I am dealing with a tricky performance problem, this is my go to tool.
Confirm that the storage engine is being used
When using DAX studio, you can see how much time is spent with the storage engine versus the formula engine. The storage engine can only handle simple operations, but is multi-threaded and very fast. Whenever possible, it’s better to make use of the storage engine.
Remove data you don’t need
Because of the way the data is stored in Power BI, the more columns you have the worse compression and performance you have. Additionally, unnecessary rows can slow things down as well. Two years of data is almost always going to be faster than 10 years of the same data.
Additionally, avoid columns with a lot of unique values such as primary keys. The more repeated values in a column, the better the compression because of run-length encoding. Unique columns can actually take up more space when encoded for Power BI than the source data did.
Avoid iterator functions
Iterator functions will calculate a result row by agonizing row, which is not ideal for a columnar data store like DAX. There are two ways to identify iterator functions. The aggregation functions generally end in an X: SUMX, MAXX, CONCATENATEX, etc. Additionally, many iterators take in a table as the first parameter and then an expression as the second parameter. Iterators with simple logic are generally fine, and sometimes are secretly converted to more efficient forms.
Use a star schema
Using a star schema, a transaction table in the center surrounded by lookup tables, has a number of benefits. It encourages filtering based on the lookup tables and aggregating based on the transaction table. The two things DAX is best at is filtering and aggregating. A star schema also keeps the relationships simple and easy to understand.
Visualization Rendering
Sometimes the issue isn’t necessarily the data model but the visuals. I’ve seen this when a user tries to put >20 different things on a page or has a table with thousands of rows.
Lean towards aggregation
The DAX engine, Vertipaq, is really good at two things: filtering and aggregations. This means it’s ideal for high level reporting like KPIs and traditional dashboards. This also means it is not good at very detail-heavy and granular reporting. If you have a table with 10,000 rows and complex measures being calculated for each row, it’s going to be really slow. If you need to be able to show detailed information, take advantage of drill-though pages or report tooltips to pre-filter the data that is being shown.
Filter what is being shown
Unless you are using simple aggregations, it’s not advisable to show all of the data at once. One way to deal with this is to apply report or page filters to limit how many rows are being rendered at any one time. Another options is to use drill-through pages and report tool-tips to implicitly filter the data being shown.
Limit how many visualizations are on screen. The part of Power BI that renders the visualization is single-threaded and can be slow sometimes. Whenever possible, try to not have more than 20 elements on screen. Even simple lines and boxes can slow down rendering a little bit.
Everything else
Review your query method. This article assumes that you are using the import method to pull in your data. However, DirectQuery or live connections might be much faster depending on the size of your data.
Sometimes a report can seem slow when you are developing it. Make sure that there aren’t any applications on your PC that are consuming all of your resources and making Power BI Desktop seem slow.
I’ve talked before about the difference between the Power Query Formula language, or M, and the DAX language.
I would describe Power Query as the intern you pay minimum wage or the sous chef, and DAX as the $35 per hour analyst or the head chef. This wasn’t to be mean but instead was just because Power Query was all about automating repetitive data manipulations. It handled the less exciting, less complicated work.
Last week, however, I presented on Power Query, and I had to update the slide about where it’s available. I used to say that wherever DAX is, Power Query was not very far behind. Doing all of the grunt work so that DAX could shine. But this time I had to update my slides because Power Query is starting to take center stage.
Now instead of just being available in Excel, Power BI and SSAS, Power Query is available in Microsoft Flow, SSIS and ADF! At the time this post was published, these are all in preview. But it’s really exciting to see Power Query no longer trailing behind DAX, ready to take center stage.
Promotion: Use code DAXERROR to save 10% off my course. Module 1 is free.
Sometimes, when working with DAX, you might get the following error:
The expression refers to multiple columns. Multiple columns cannot be converted to a scalar value.
This error occurs whenever the DAX engine was expecting a single value, or scalar, and instead received a table of values instead. This is an easy error to make because many DAX functions, such as FILTER, SUMMARIZE and ALL, return table values. There are three situations where this error commonly occurs:
Assigning a table value to a measure or calculated column
Forgetting to use a DAX aggregation
Treating ALL or FILTER as an action, not a function
In the rest of the post, we’ll cover each scenario and how to fix it.
Assigning a table value to a measure or calculated column
Let’s say that you were doing some analysis on the products table in the AdventureWorks sample database. In this case, maybe you want to only look at the black products. So you create a measure with the following code:
One solution to this problem is instead of assigning the code to a measure, which is intended to display a single value, you can create a calculated table instead.
To do so, go to Modeling –> New table in Power BI Desktop. Then ender the same code as before but for the calculated table. Now you will see a table filtered accordingly.
Forgetting to use a DAX aggregation
Now, what if we actually did want a single value instead of a table? Let’s say we want to count the number of black products. In that case, we could wrap our code in an aggregation function, such as COUNTROWS which can take in a table and return a single value.
This code will return the count of all products, but only if they have black as the color.
Treating ALL or FILTER as an action, not a function
Sometimes, people will try to use functions like ALL or FILTER to filter information on the report. By themselves, these functions actually return a table. However, when they are used with CALCULATE and CALCULATETABLE then you can use them to filter your data appropriately.
Promotion: Use code DAXERROR to save 10% off my course. Module 1 is free.
Whenever you start trying to use more complicated filters in the CALCULATE or CALCULATETABLE functions in DAX, you may start to get the following error:
A function 'MAX' has been used in a True/False expression that is used as a table filter expression. This is not allowed.
The function in single quotes may vary. Instead of MAX, it could be SUM, MIN, AVERAGE or nearly anything. Sometimes, you may not even be using a function and the error will just say CALCULATE is the problem:
A function 'CALCULATE' has been used in a True/False expression that is used as a table filter expression. This is not allowed.
What causes this error?
The error is caused by using a TRUE/FALSE expression, something that evaluates to TRUE or FALSE, to filter the table in a way that CALCULATE or CALCULATETABLE doesn’t support. So the error is saying you can’t use a boolean comparison to filter your table except in very specific circumstances.
The following comparisons are not supported:
Comparing to a column to a measure. SalesHeader[TerritoryID] = [LargestTerritory]
Comparing a column to a an aggregate value. SalesHeader[TerritoryID] = MAX(TerritoryID[TerritoryID]])
Comparing a column to a What-If parameter. SalesHeader[TerritoryID] =
TerritoryParameter[TerritoryParameter Value]
In fact, you only have three options if you want to filter a column in a CALCULATE/CALCULATETABLE function:
Compare the column to a static value. SalesHeader[TerritoryID] = 6
Use variables to create a static value. VAR LargestTerritory = MAX(SalesHeader[TerritoryID])
Use a FILTER function instead of a true/false expression. FILTER(SalesHeader, SalesHeader[TerritoryID] = [LargestTerritory])
This is because CALCULATE was designed for safety and performance. Complex row based comparisons can dramatically affect performance. So, in order to do more complex comparisons, you have to take the safety feature off and use the FILTER function.
How do I fix it?
In order to fix the issue, wrap your expression in the FILTER function. To use the FILTER function, you need to pass in the table you want to filter, and then a TRUE/FALSE expression to determine which rows get return. So, let’s say we had the following code:
CALCULATE (
    SUM ( SalesHeader[TotalDue] ),
    SalesHeader[TerritoryID] = [LargestTerritory]
)
to use the FILTER function, we would use this:
CALCULATE (
    SUM ( SalesHeader[TotalDue] ),
    FILTER ( ALL ( SalesHeader[TerritoryID] ), SalesHeader[TerritoryID] =    [LargestTerritory] )
)
The ALL function isn’t strictly necessary, but normally when we filter a single column in a CALCULATE function, it will undo any existing filters on that column. We use ALL here to replicate that behavior. In order to understand the specifics better, check out this article at sqlbi.com
At the time of this writing, Power BI Aggregations are still in preview and actively being worked on. Once they leave preview, I expect this issue will either be fixed, or the limitations will be specified in the documentation, just like with DirectQuery in general.
Currently whenever I try to use a what-if parameter or a disconnected parameter table, Power BI Aggregations don’t work as intended, instead it reverts to Direct Query. Which means if I need to use a parameter of some sort, I can’t get the benefit of using aggregations.
UPDATE: This issue seems to depend on where they are being used. Reza Rad identified that the issue does not occur in an if statement.
UPDATE 2: According to Microsoft, this is intended behavior because the parameters aren’t in the pre-aggregations or the mappings. I’ve created a uservoice ticket for this.
Setup
To reproduce this issue, I’ve made an extremely simple data model based AdventureWorks2014 data. There are 4 tables involved with no direct relationships:
SalesHeader, which is my fact table, stored in directquery mode.
SalesHeaderAgg, which is my aggregation table, stored in import mode.
TerritoryParameter, which is a What If Parameter, generated with DAX
Territory, which is a disconnected table, stored in dual mode.
I’ve mapped all the columns from my aggregations table to my detail table. In theory, all DAX queries that don’t require a count on CustomerID or TerritoryID, should hit the aggregation table.
To start with, I have a table summing TotalDue by Customer.
I’ve connected profiler to the SSAS instance that Power BI Desktop runs in the background. This allows us to see what is bring run behind the scenes and if it is hitting the aggregation table.
In this case, Power BI Desktop is doing a TOPN:
EVALUATE
TOPN (
502,
SUMMARIZECOLUMNS (
ROLLUPADDISSUBTOTAL ( ‘SalesHeader'[CustomerID], “IsGrandTotalRowTotal” ),
“SumTotalDue”, CALCULATE ( SUM ( ‘SalesHeader'[TotalDue] ) )
),
[IsGrandTotalRowTotal], 0,
‘SalesHeader'[CustomerID], 1
)
ORDER BY
[IsGrandTotalRowTotal] DESC,
‘SalesHeader'[CustomerID]
And looking at the events, we can see a successful query rewrite, with no DirectQuery events. everything looks good.
The problem
Instead of using an implicit measure, let’s use a explicit measure, with a filter based on a parameter field:
Param Total =
CALCULATE (
SUM ( SalesHeader[TotalDue] ),
FILTER (
SalesHeader,
SalesHeader[TerritoryID] = TerritoryParameter[TerritoryParameter Value]
)
)
And at first, everything looks fine. No DirectQuery calls.
But, if I select one of the parameter values using a slicer, now it switches to using DirectQuery.
So what’s the difference? Well in the second DAX query, it’s applying the filter via TREATAS
What if I use an actual table in dual storage mode and just take the MAX instead?
Param Total =
CALCULATE (
SUM ( SalesHeader[TotalDue] ),
FILTER (
SalesHeader,
SalesHeader[TerritoryID] = MAX ( Territory[TerritoryID] )
)
)
Well, I get the same exact DAX pattern and the same result.
Conclusion
Ultimately, this is one of the tradeoffs of using preview functionality. I’m working with the customer to get a ticket escalated with Microsoft. Ultimately, it may just be an intended limitation of the technology. I hope not, though, because aggregations provide for huge performance improvements with minimal effort.
That being said, if anyone has any ideas, I’m all ears! Below is my proof of concept.
When I heard about custom data connectors for Power Query, I had assumed there would be a lot of work involved. While there is definitely quite a bit of work in implementing advanced features like query folding, creating your very first connector is simple.
So, first you need Visual studio installed and the Power Query SDK installed as well. Once you do that, you will see Power Query as an option when creating a new project. Visual studio will also have support for .pq or Power Query files.
Once you create a new data connector project, you are presented with two main Power Query files. The first one, is simply a test query you can run on demand to test your connector.
The other file is your data connector. It has a bit of boilerplate to specify the types of credentials it accepts and publishing details such as beta status. Otherwise there is just a little bit of code defining the actual functionality. In this case we are defining the Contents function, which acts as a hello world:
If we run it as is, our test query will be run and we’ll see the results in a testing program.
Adding a function
So now, what if we want to add some more functionality? Say maybe a function to square numbers. First, we’ll add a SquareNumbers.Squared function to the main file:
shared SquareNumbers.Squared = (x as number) =>
let
y = x * x
in
y;
Then we update the sample query to call out function:
let
result = SquareNumbers.Square(7)
in
result
And it works as expected:
Exporting the connector
Once you have the connector working the way that you want, run a release build in visual studio. This will create a .mez in the bin/Release folder of your solution. Copy that file to the [Documents]\Power BI Desktop\Custom Connectors folder. You will likely have to create that folder.
Whenever you open Power BI Desktop, it will recognize the connector but won’t let you use it because of security settings.
To get around this, go into the options for Power BI Desktop and then security. Under security, select “Allow any extension to load without validation or warning.” Then Restart Power BI Desktop.
Now we can see it is available in our list of connectors.
By default it will call the Contents function:
But we can easily modify the M code to call our squared function as well.
Which will give us the output we expect.
What next?
If you are interested in going deeper with Custom Data Connectors, such as adding a navigation view or query folding, check out the TripPin tutorials.
I’m quite excited to announce the new Power BI skills assessment on Pluralsight is in beta. This assessment is the result of me spending dozens of hours writing questions and some wonderful peer review by Gilbert Quevauvillie. Please do me a favor and take it. It will take 15 minutes and we need your help to calibrate it.
I’ve received feedback that some of the questions are a bit weird and not really core Power BI skills. For example, there are questions about R syntax, deploying to SharePoint, etc. That’s by design. The assessment is self-calibrating as people take it. Once it goes live, those harder, oddball questions will only show up when you’ve correctly answered the easier core questions.
The reason we need your help is we need to know which questions are easy, which questions are hard, which questions are correlated, which questions are too guessable. I appreciate everyone’s help in getting the assessment to be ready to go live.
Something that some people search for is the question “Why is Power BI Free?”.Power BI is free because it benefits Microsoft to have an easy on-ramp to Power BI and to attract as large an audience as possible. It is in their financial interest.
If you are wondering what the catch is, the catch is that the free version of Power BI has very limited sharing capabilities, among other features.
In this post, I’m going to cover some reasons why Microsoft would make Power BI free. But before we can elaborate on all of that, we need to clarify what we mean by “free”. Read my post from last week for more details.
So why is it free?
So why would it behoove Microsoft to provide a limited free version of Power BI? Some ideas come to mind:
People can learn for free. This is important since Microsoft is aiming for a broader audience instead of a deeper one. The main target audience for Power BI is the everyday business user, not BI developers.
People are skeptical. It can be hard to convince a business to make a large investment in a BI product. By having a free version, a small group of people can do a pilot project without spending any money.
Razors-and-blades sales model. Companies will often sell products at a loss or give them away for free, if there is a paid compliment needed to take advantage of that product. Think about how cheap printers are, but how expensive ink is, for example.
SaaS is where they make their money. Related to the previous item, Microsoft makes a lot of their money these days from subscriptions. It used to be that they primarily sold software as standalone packages. But in the last few years, they are making more and more money from Saas like Office 365, or cloud computing like Azure. Power BI fits neatly into that space.
Free dashboards are good marketing. Some people will make really cool and innovative dashboards and then share them publicly. This doesn’t detract from Microsoft’s business model at all. Free users are free marketing.
Overall, Power BI is free because so much of the real value comes from the enterprise collaboration and sharing. You can make beautiful visuals with a lot of tools, but few compare to the IT Governance story that Microsoft has.
Power BI Desktop, the authoring tool, is completely free to use. Users can also create free accounts on the Power BI service, with a number of restrictions. In short, Power BI is free to get started, but if you want to do any serious professional work you are going to have to pay for a license.
Some pieces of Power BI are free and some aren’t. Parts that are available for free:
Power BI Desktop
Power BI Service (with limitations)
Power BI Mobile
Parts that are not available for free:
Enterprise sharing and collaboration
Power BI Report Server
Power BI Premium
Which parts are actually free?
Power BI Desktop
First there is the report authoring tool, known as Power BI Desktop. This tooling is completely free to use.
You will have to either create an account or deal with some mild nagging about signing up for a mailing list. You can disable that nagging with a registry change.
While Power BI Desktop is a great authoring tool, it is a terrible collaboration tool. If you were to live entirely in PBI Desktop, you’d have to pass around PBIX files which is incredibly clunky.
In my opinion, if you are going to look at using an on-premises, self-service tool you are better off using Excel. You still get a lot of the same capabilities with Power Query and Power Pivot, but inside of a tool people understand, and a tool Office 365 can render online.
Power BI Service
The Power BI Service, think powerbi.com, allows for free users. These free users can create reports and upload them, but with a significant number of limitations. The biggest is you only have one way of sharing content to others. Specifically with Publish to Web, which essentially makes your entire report free to the public.
You also only have one way of privately consuming other people’s reports, and that’s if someone places content in Power BI Premium. Otherwise, other users can’t share their reports directly with you. Power BI Free users are truly and island to themselves.
One other thing worth nothing is that you can’t sign up with a personal email. David Eldersveld has a good blog post on the issue. As of this writing, the uservoice request to change this has 2,800 votes.
See here for some more limitations of the free version of Power BI.
Power BI Mobile
Power BI Mobile is a way to consume Power BI Reports on Apple, Android and Windows mobile devices. Here is a picture of Power BI Mobile on my phone.
Which parts aren’t free?
Enterprise sharing and collaboration
Power BI is, by design, a collaboration tool. It is designed for people to publish and share their reports. If you want to take advantage of content curation using app workspaces, you’ll need to pony up and pay for a Power BI pro license.
If you are doing any real work with Power BI, you are going need to pay for a license for yourself as well as any report consumers.
Power BI Report Server
In addition to Power BI Pro, there is Power BI Report Server, which is the on-premises solution for hosting Power BI Reports. If you decide to go with Power BI Report server instead of making use of the Power BI Service, then you are going to need to pay for SQL Server Enterprise as well as Software Assurance. Alternatively you could pay for Power BI Premium.
Power BI Premium
Power BI premium is an alternate licensing model where you are licensing the content instead of the users. Once you have 500 or more users, it starts to make sense. Until then, the $5,000 per month is pretty pricey. It has other benefits as well, such as paginated reports and incremental refresh.
Summary
Some parts of Power BI is Free, but once you want to share with others, use more advanced features, or alternate deployment options, you are going to have to start paying.

![clip_image001[5]](https://www.sqlgene.com/wp-content/uploads/2019/09/clip_image0015.jpg "clip_image001[5]")