Category Archives: DAX

A comprehensive guide to Power BI performance tuning

Promotion: Use code PERFBLOG to save 10% off my course. Module 1 is free.

While it’s easy to make reports in Power BI, it can be a pain to troubleshoot and tune them. Properly performance tuning Power BI reports requires identifying the bottleneck and using a handful of external applications. This article covers how to narrow down the performance problem, as well as general best practices. Once you understand the fundamentals it gets a lot easier.

Which part is slow?

As a report developer, it can be frustrating a report developer, knowing that something is slow, but not being able to put your finger on it. In my mind, there are 4 main areas where there might be a slowdown:

  1. Data refresh
  2. Model calculations
  3. Visualization rendering
  4. Everything else

Identifying which one of these is the problem is the first step to improving performance. In most cases, if a report is slow it’s an issue with step 2, your data model.

Tuning the data refresh

The refresh is rarely the problem because the user never sees the refresh process if you are using Import mode. So usually you are going to see a slow refresh when you are authoring the report or if a scheduled refresh fails. Still, it’s important to tune your data refresh to avoid timeouts and minimize how much data your are loading.

Verify that query folding is working

If you are querying a relational database, especially SQL Server, then you want to make sure that query folding is being applied. Query folding is when M code in PowerQuery is pushed down to the source system, often via a SQL query. One simple way to confirm that query folding is working is to right click on a step sand select View Native Query. This will show you the SQL query that will be run against the database. If you have admin privileges on the server, you can also use extended events to monitor the server for queries. If you are doing this, you should limited the monitoring to the Data Mashup engine, which is the application name for Power Query.

Some transformation steps can break query folding, making any steps after them unfoldable. Finding out which steps break folding is a matter of trial and error. But simple transformations, such as filtering rows and removing columns, should be applied as early

Minimize the data you are loading

If you don’t need certain columns, then remove them. If you don’t need certain rows of data, then filter them out. This can improve performance when refreshing the data AND when modelling it later on, which is a win-win.

If your Power BI file is more than 100MB, there is a good chance you are going to see a slowdown due to the data size. Once it gets bigger than that it is important to either work on your DAX code, or look into an alternative querying/hosting method such as DirectQuery or Power BI Premium.

Consider performing joins in DAX, not in M

If you need to establish a relationship purely for filtering reasons, such as using a dimension table, then consider creating the relationship in DAX instead of in PowerQuery. DAX is blazing fast at applying filters, whereas Power Query can be very slow at applying a join, especially if that join is not being folded down to the SQL level. That being said, sometimes the data makes more sense as a flattened table for usability purposes.

Review your applied steps

Because Power Query is such a graphical tool, it can be easy to make changes and then forget about them. I had one customer who would often sort his data and then accidently leave the step in there. This was terrible for performance.

Make use of SQL indexes

If your data is in a relational database, then you want to make sure there are indexes to support your queries. If you are using just a few columns it may be possible to create a covering query that covers all of the columns you need. Work with your DBA to see what your options are. If you are using SQL Server, you can use execution plans to identify if the query is using an index. You will need the SHOW_PLAN permission on the server and you will need to use the View Native Query functionally to get the underlying SQL query

Tuning the model calculations

When someone says that a Power BI report is slow, it is usually an issue with the DAX modelling. Unfortunately, that fact isn’t obvious to the user and it can look like the visuals themselves are slow. Thankfully, there is a tool to identify the difference: the Power BI Performance Analyzer.

Use the Power BI Performance Analyzer

If your report is slow, the very first thing you should do is run the Power BI performance analyzer. This will give you detailed measurements of which visuals are slow as well as how much of that time is spent running DAX and how much is spent rendering the visual. Additionally, this tool gives you the actual DAX code being run behinds the scenes, which you can run manually with DAX Studio. When I am dealing with a tricky performance problem, this is my go to tool.

Confirm that the storage engine is being used

When using DAX studio, you can see how much time is spent with the storage engine versus the formula engine. The storage engine can only handle simple operations, but is multi-threaded and very fast. Whenever possible, it’s better to make use of the storage engine.

Remove data you don’t need

Because of the way the data is stored in Power BI, the more columns you have the worse compression and performance you have. Additionally, unnecessary rows can slow things down as well. Two years of data is almost always going to be faster than 10 years of the same data.

Additionally, avoid columns with a lot of unique values such as primary keys. The more repeated values in a column, the better the compression because of run-length encoding. Unique columns can actually take up more space when encoded for Power BI than the source data did.

Avoid iterator functions

Iterator functions will calculate a result row by agonizing row, which is not ideal for a columnar data store like DAX. There are two ways to identify iterator functions. The aggregation functions generally end in an X: SUMX, MAXX, CONCATENATEX, etc. Additionally, many iterators take in a table as the first parameter and then an expression as the second parameter. Iterators with simple logic are generally fine, and sometimes are secretly converted to more efficient forms.

Use a star schema

Using a star schema, a transaction table in the center surrounded by lookup tables, has a number of benefits. It encourages filtering based on the lookup tables and aggregating based on the transaction table. The two things DAX is best at is filtering and aggregating. A star schema also keeps the relationships simple and easy to understand.

Visualization Rendering

Sometimes the issue isn’t necessarily the data model but the visuals. I’ve seen this when a user tries to put >20 different things on a page or has a table with thousands of rows.

Lean towards aggregation

The DAX engine, Vertipaq, is really good at two things: filtering and aggregations. This means it’s ideal for high level reporting like KPIs and traditional dashboards. This also means it is not good at very detail-heavy and granular reporting. If you have a table with 10,000 rows and complex measures being calculated for each row, it’s going to be really slow. If you need to be able to show detailed information, take advantage of drill-though pages or report tooltips to pre-filter the data that is being shown.

Filter what is being shown

Unless you are using simple aggregations, it’s not advisable to show all of the data at once. One way to deal with this is to apply report or page filters to limit how many rows are being rendered at any one time. Another options is to use drill-through pages and report tool-tips to implicitly filter the data being shown.

Limit how many visualizations are on screen. The part of Power BI that renders the visualization is single-threaded and can be slow sometimes. Whenever possible, try to not have more than 20 elements on screen. Even simple lines and boxes can slow down rendering a little bit.

Everything else

Review your query method. This article assumes that you are using the import method to pull in your data. However, DirectQuery or live connections might be much faster depending on the size of your data.

Sometimes a report can seem slow when you are developing it. Make sure that there aren’t any applications on your PC that are consuming all of your resources and making Power BI Desktop seem slow.

Power Query Is No Longer DAX’s Little Brother

I’ve talked before about the difference between the Power Query Formula language, or M, and the DAX language.

I would describe Power Query as the intern you pay minimum wage or the sous chef, and DAX as the $35 per hour analyst or the head chef. This wasn’t to be mean but instead was just because Power Query was all about automating repetitive data manipulations. It handled the less exciting, less complicated work.

Last week, however, I presented on Power Query, and I had to update the slide about where it’s available. I used to say that wherever DAX is, Power Query was not very far behind. Doing all of the grunt work so that DAX could shine. But this time I had to update my slides because Power Query is starting to take center stage.

Now instead of just being available in Excel, Power BI and SSAS, Power Query is available in Microsoft Flow, SSIS and ADF! At the time this post was published, these are all in preview. But it’s really exciting to see Power Query no longer trailing behind DAX, ready to take center stage.

DAX Error: The Expression Refers to Multiple Columns. Multiple Columns Cannot Be Converted to a Scalar Value.

Promotion: Use code DAXERROR to save 10% off my course. Module 1 is free.

Sometimes, when working with DAX, you might get the following error:

The expression refers to multiple columns. Multiple columns cannot be converted to a scalar value.

This error occurs whenever the DAX engine was expecting a single value, or scalar, and instead received a table of values instead. This is an easy error to make because many DAX functions, such as FILTER, SUMMARIZE and ALL, return table values. There are three situations where this error commonly occurs:

  1. Assigning a table value to a measure or calculated column
  2. Forgetting to use a DAX aggregation
  3. Treating ALL or FILTER as an action, not a function

In the rest of the post, we’ll cover each scenario and how to fix it.

Assigning a table value to a measure or calculated column

Let’s say that you were doing some analysis on the products table in the AdventureWorks sample database. In this case, maybe you want to only look at the black products. So you create a measure with the following code:

BlackProducts = FILTER(Products, Products[Color] = “Black”)

image

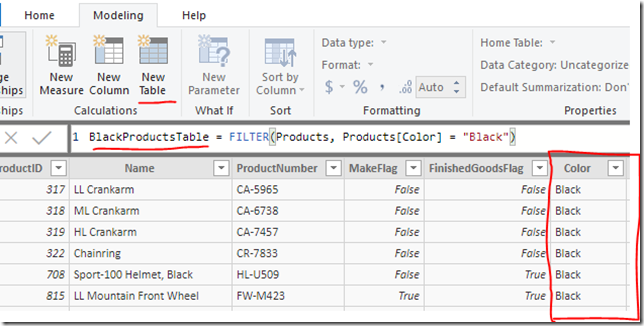
One solution to this problem is instead of assigning the code to a measure, which is intended to display a single value, you can create a calculated table instead.

To do so, go to Modeling –> New table in Power BI Desktop. Then ender the same code as before but for the calculated table. Now you will see a table filtered accordingly.
image

Forgetting to use a DAX aggregation

Now, what if we actually did want a single value instead of a table? Let’s say we want to count the number of black products. In that case, we could wrap our code in an aggregation function, such as COUNTROWS which can take in a table and return a single value.

CountOfBlackProducts = COUNTROWS(FILTER(Products, Products[Color] = “Black”))

This code will return the count of all products, but only if they have black as the color.

Treating ALL or FILTER as an action, not a function

Sometimes, people will try to use functions like ALL or FILTER to filter information on the report. By themselves, these functions actually return a table. However, when they are used with CALCULATE and CALCULATETABLE then you can use them to filter your data appropriately.

Want to learn more?

If you want to learn more about DAX, then check out my free learning path and my paid Pluralsight course.

DAX error: A function ‘XXXX’ has been used in a True/False expression that is used as a table filter expression. This is not allowed.

Promotion: Use code DAXERROR  to save 10% off my course. Module 1 is free.

Whenever you start trying to use more complicated filters in the CALCULATE or CALCULATETABLE functions in DAX, you may start to get the following error:

A function 'MAX' has been used in a True/False expression that is used as a table filter expression. This is not allowed.

image

The function in single quotes may vary. Instead of MAX, it could be SUM, MIN, AVERAGE or nearly anything. Sometimes, you may not even be using a function and the error will just say CALCULATE is the problem:

A function 'CALCULATE' has been used in a True/False expression that is used as a table filter expression. This is not allowed.

image

What causes this error?

The error is caused by using a TRUE/FALSE expression, something that evaluates to TRUE or FALSE, to filter the table in a way that CALCULATE or CALCULATETABLE doesn’t support.  So the error is saying you can’t use a boolean comparison to filter your table except in very specific circumstances.

The following comparisons are not supported:

    1. Comparing to a column to a measure. SalesHeader[TerritoryID] = [LargestTerritory]
    2. Comparing a column to a an aggregate value. SalesHeader[TerritoryID] = MAX(TerritoryID[TerritoryID]])
    3. Comparing a column to a What-If parameter. SalesHeader[TerritoryID] =

TerritoryParameter[TerritoryParameter Value]

In fact, you only have three options if you want to filter a column in a CALCULATE/CALCULATETABLE function:

  1. Compare the column to a static value. SalesHeader[TerritoryID] = 6
  2. Use variables to create a static value. VAR LargestTerritory = MAX(SalesHeader[TerritoryID])
  3. Use a FILTER function instead of a true/false expression. FILTER(SalesHeader, SalesHeader[TerritoryID] = [LargestTerritory])

This is because CALCULATE was designed for safety and performance. Complex row based comparisons can dramatically affect performance. So, in order to do more complex comparisons, you have to take the safety feature off and use the FILTER function.

How do I fix it?

In order to fix the issue, wrap your expression in the FILTER function. To use the FILTER function, you need to pass in the table you want to filter, and then a TRUE/FALSE expression to determine which rows get return. So, let’s say we had the following code:

CALCULATE (
    SUM ( SalesHeader[TotalDue] ),
    SalesHeader[TerritoryID] = [LargestTerritory]
)

to use the FILTER function, we would use this:

CALCULATE (
    SUM ( SalesHeader[TotalDue] ),
    FILTER ( ALL ( SalesHeader[TerritoryID] ), SalesHeader[TerritoryID] =    [LargestTerritory] )
)

The ALL function isn’t strictly necessary, but normally when we filter a single column in a CALCULATE function, it will undo any existing filters on that column. We use ALL here to replicate that behavior. In order to understand the specifics better, check out this article at sqlbi.com

Parameters not yet supported in Power BI Aggregations

At the time of this writing, Power BI Aggregations are still in preview and actively being worked on.  Once they leave preview, I expect this issue will either be fixed, or the limitations will be specified in the documentation, just like with DirectQuery in general.

Currently whenever I try to use a what-if parameter or a disconnected parameter table, Power BI Aggregations don’t work as intended, instead it reverts to Direct Query. Which means if I need to use a parameter of some sort, I can’t get the benefit of using aggregations.

UPDATE: This issue seems to depend on where they are being used. Reza Rad identified that the issue does not occur in an if statement.

UPDATE 2: According to Microsoft, this is intended behavior because the parameters aren’t in the pre-aggregations or the mappings. I’ve created a uservoice ticket for this.

Setup

To reproduce this issue, I’ve made an extremely simple data model based AdventureWorks2014 data. There are 4 tables involved with no direct relationships:

  1. SalesHeader, which is my fact table, stored in directquery mode.
  2. SalesHeaderAgg, which is my aggregation table, stored in import mode.
  3. TerritoryParameter, which is a What If Parameter, generated with DAX
  4. Territory, which is a disconnected table, stored in dual mode.

image

I’ve mapped all the columns from my aggregations table to my detail table. In theory, all DAX queries that don’t require a count on CustomerID or TerritoryID, should hit the aggregation table.

image

To start with, I have a table summing TotalDue by Customer.

image

I’ve connected profiler to the SSAS instance that Power BI Desktop runs in the background. This allows us to see what is bring run behind the scenes and if it is hitting the aggregation table.

In this case, Power BI Desktop is doing a TOPN:

EVALUATE
TOPN (
502,
SUMMARIZECOLUMNS (
ROLLUPADDISSUBTOTAL ( ‘SalesHeader'[CustomerID], “IsGrandTotalRowTotal” ),
“SumTotalDue”, CALCULATE ( SUM ( ‘SalesHeader'[TotalDue] ) )
),
[IsGrandTotalRowTotal], 0,
‘SalesHeader'[CustomerID], 1
)
ORDER BY
[IsGrandTotalRowTotal] DESC,
‘SalesHeader'[CustomerID]

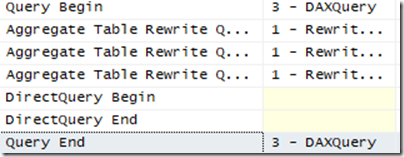
And looking at the events, we can see a successful query rewrite, with no DirectQuery events. everything looks good.

image

The problem

Instead of using an implicit measure, let’s use a explicit measure, with a filter based on a parameter field:

Param Total =
CALCULATE (
SUM ( SalesHeader[TotalDue] ),
FILTER (
SalesHeader,
SalesHeader[TerritoryID] = TerritoryParameter[TerritoryParameter Value]
)
)

And at first, everything looks fine. No DirectQuery calls.

image

But, if I select one of the parameter values using a slicer, now it switches to using DirectQuery.

image

So what’s the difference? Well in the second DAX query, it’s applying the filter via TREATAS

image

What if I use an actual table in dual storage mode and just take the MAX instead?

Param Total =
CALCULATE (
SUM ( SalesHeader[TotalDue] ),
FILTER (
SalesHeader,
SalesHeader[TerritoryID] = MAX ( Territory[TerritoryID] )
)
)

Well, I get the same exact DAX pattern and the same result.

Conclusion

Ultimately, this is one of the tradeoffs of using preview functionality. I’m working with the customer to get a ticket escalated with Microsoft. Ultimately, it may just be an intended limitation of the technology. I hope not, though, because aggregations provide for huge performance improvements with minimal effort.

That being said, if anyone has any ideas, I’m all ears! Below is my proof of concept.

ParametersDemo

Power BI Learning Path – Free and Paid Resources

how to keep up with technology. When you are starting out with a technology, it’s just plain hard to get a lay of the land.

So, I thought I’d put together a learning path for Power BI, a technology that changes literally every month. This is a bit of challenge because there are so many moving parts when it comes to Power BI. Accordingly, let’s break down those moving parts into different categories.

image

So, when I think about Power BI, I like to think about the flow of data. First we have the Data prep piece with Power Query, where we clean up dirty data. Next we model the data with DAX. I’ve written before about the difference between Power Query and DAX. They are like peanut butter and jelly and compliment each other well.

Now, if you are a SQL expert, you may not need to worry about Power Query or DAX much. Maybe you do a lot of the work in SQL. But either way, once your data is modeled, you need to visualize it in some way. You need to learn how to create your reports with Power BI Desktop. Once your report is created, you then need to publish it.

Finally, there is what I would call the IT Ops side of Power BI. You have to install an on-premises data Gateway to access local data. You need to license your users. You need to lock down security. All of these things might be outside of what a normal BI developer has to deal with, but are still important pieces. However, unlike the data flow model we talked about, the ops pieces happens at all of the stages of development and deployment.

With that overview in place, let’s get on to the individual sections and the learning paths as a whole.

Getting started with Power BI

When it comes to getting started with Power BI, I have two recommendations. First get your hands dirty, and secondly buy a book. Power BI is in many ways an amalgamation of disparate technologies. It took me a long time to to understand it and it didn’t really click until I took the edX course and did actual labs.

The reason I say to buy a book is this is a technology that is hard to learn piecemeal. When you are starting out you are much better off having a curated tour of things.

Free resources

  • Check out Adam Saxton’s getting started video.
  • Search Youtube for Dashboard in an Hour. This is a standardized presentation that will show you the basics in under an hour.
  • Follow the guided learning. This will walk you through bite sized tasks with Power BI.
  • Take the edX course. It has actual labs where you have to work with data inside of Power BI.
  • Check out the Introducing Microsoft Power BI book from Microsoft Press. It’s a bit dated at this point, but it’s free and is a great start.
  • Check out the Power BI: Rookie to Rockstar book from Reza Rad (b|t). The last update was July 2017, but it’s also very comprehensive and good.

Paid resources

  • Stacia Misner Varga (b|t) has a solid course on Pluralsight. It’s worth a watch.
  • Consider reading the Applied Power BI by Teo Lachev (b|t). It’s a real deep dive which is great, but can be a lot to take in if you are just getting started. A neat feature is that it’s organized by job role.

Learning Power Query and M

When it comes to self-service data preparation, Power Query is THE tool. The way I describe it is as a macro language for manual data manipulations. If you can pay someone minimum wage to do it in Excel, you can automate it in Power Query. Again, check out this post for the differences between Power Query and DAX.

Free Resources

  • Start with the guided learning. This quickly covers the basics
  • Reza Rad has a solid getting started post on Power Query that you can follow along with.
  • Matt Masson has a phenomenal deep dive video on the Power Query formula language, a.k.a M, from a year ago. It really helps elucidate the guiding principals of Power Query and M.
  • Blogs to check out:
    • Imke Feldmann (b|t) regularly has complex functions and interesting transformations on her blog.
    • Ken Puls (b|t) focuses on Excel and along with that, Power Query.
    • Gil Raviv (b|t) often has neat examples of things you can do with Power BI and Power Query.
    • Chris Webb (b|t) regularly dives into the innards of Power Query and what you can do with it.

Paid Resources

  • Ben Howard (b|t) has a Pluralsight course on Power Query. It’s a bit introductory, but great if you are just getting started.
  • Gil Raviv recently (October 2018) released a book on Power Query. What I really like about this book is it has more of a progression style instead of a cookbook kind of feel.
  • Ken Puls and Miguel Escobar (b|t) also have a book on Power query that has a cookbook feel. I found it helpful in learning Power Query, but it’s heavily aimed at excel users.
  • Finally, Chris Webb also has a book on Power Query. He goes into a lot of detail with it. However, the 2014 publish date means it’s starting to get a bit old.

Learning DAX

I always say that DAX is good at two things: aggregating and filtering. You aren’t doing those two things, then DAX is the wrong tool for you. DAX provides a way for you to encapsulate quirky business logic into your data model, so that end users doing have to worry about edge cases and such.

Free Resources

  • Read the DAX Basics article from Microsoft
  • Check out the guided learning on DAX
  • Learn the difference between Calculated columns and Measures in DAX. They can be confusing.
  • Make sure you understand the basics with SUM, CALCULATE and FILTER
  • Understand Row and Filter contexts. They are critical for advanced work in DAX
  • Blogs to check out
    • Matt Allington (b|t) has a blog with Excel right in the name but also writes about all the different parts of Power BI Desktop.
    • Rob Collie (b|t) has a voice all his own. read his blog to learn about DAX and PowerPivot without taking yourself too seriously.
    • Alberto Ferrari (b|t) and Marco Russo (b|t) are THE experts on DAX. Read their blog. Also see their site DAX.guide.
    • Avi Singh (b|t) regularly posts videos on Power BI and will often take live questions.

Paid Resources

Power BI Visuals

The piece of Power BI that is most prominent are they visuals. While it’s incredibly easy to get started, I find this area to be the most difficult. If you are heavily experience in reporting this shouldn’t be too difficult to learn.

Free resources

Paid resources

  • A really interesting book is The Big Book of Dashboards. While it doesn’t mention Power BI, it covers all the ways to highlight data and what really makes a dashboard.

Administering Power BI

Power BI is much more than a reporting tool. It is a reporting infrastructure. This means at some point you may have to learn how to administer it as well.

Free resources

Paid resources

Keeping up with Power BI

One of the big challenges with Power BI is just keeping up. They release to new features each and every month. Here are a few resources to stay on top of things:

Going Deeper

Finally, you may want to go even deeper with things. Here are some final recommendations:

#SQLChefs: Power BI Datasets, Reports and Dashboards

This week we’ve got another episode of SQLChefs with Bert Wagner, where we talk about the different between datasets, reports and dashboards in Power BI.

What are datasets?

A Power BI Dataset is a series of Power Query queries that have been shaped in a DAX model. Each dataset can combine different files, database tables and online services all into one tabular model.  In our cookie analogy, these are all different “ingredients”.

Unlike SSRS, a dataset in Power BI does not represent a single table or query of data. A dataset should be considered more like a “flavor” of data used to accomplish a specific type of reporting: financial, operational, HR, etc. So in our analogy, the dataset is the “raw dough”.

So in Power Query, you are going to have a set of queries which each combine a data source with a usually linear set of transformations.

image

Then, in DAX, you are going to take each of those outputs and combine them into a model. This consists of defining relationships between the outputted tables and adding business logic via calculated columns and measures.

image

For more on the difference between Power Query and DAX, see our previous episode of SQLChefs.

What are reports?

A power BI report is a series of visualizations, filters and static elements on a canvas. Power BI reports are saved as a single PBIX file and connect to a single dataset. Remember, a Power BI dataset can have many data sources.

image

(Demo file courtesy of Microsoft, MIT License)

Each report can have multiple sheets, just like an Excel workbook. In our analogy, this is us placing our “cookies” on multiple “cookie sheets” making one big batch, all of the same “flavor”.

One report per dataset

A quick aside to something that used to confuse me. In most cases, a report and a dataset are going to have a one to one relationship. A dataset can have one report and a report can have one data set.

Recently this has changed, however. A while back, they added the ability to use an existing dataset as a data source for a report. and at Ignite they announced the ability to share datasets outside of the app workspace they were made in.

That being said, while you are still learning Power BI, it’s easier to remember that in many cases, your dataset and your report are going to have a one-to-one relationship and be tightly linked.

What are dashboards?

In Power BI, dashboards are a way of pulling together visualizations from various reports. When you think dashboard, you are probably thinking something like Microsoft’s definition: “A Power BI dashboard is a single page, often called a canvas, that uses visualizations to tell a story. Because it is limited to one page, a well-designed dashboard contains only the most-important elements of that story.”

However, if you look at the report example above, it probably fits that definition. It is not a Power BI Dashboard. In Power BI, a dashboard is tool for pinning visuals from different reports and other sources of data.

image

In my opinion, a Power BI Dashboard is as much a tool for organization and navigation, as it is for actual reporting. I think that’s the real value add with Power BI dashboards.

M vs DAX: Chopping Broccoli vs Planning a Menu

Last week, I had the pleasure of recording some video with Bert Wagner about Power BI. In the video, I got to use one of my favorite analogies for M versus DAX: Are you chopping broccoli or planning a menu?

One of the challenges with learning Power BI, is that you have to learn not 1, but 2 new data manipulations languages. And it’s not always clear what they are good for, especially if you come from the SQL world.

Is M a general purpose knife, or one of those weird egg slicers?

Head Chefs versus Sous Chefs

I have never worked in the restaurant business, but I’m going to make some gross generalizations anyway.

Sous chefs, as far as I can tell, do a lot of the prep work. They are cutting vegetables, cleaning food, making sauces, etc. While this is all important work, much of it doesn’t inform the final outcome. If you are making beef teriyaki or if you are making broccoli salad,  you still need to chop the broccoli.

The head chef however, gets paid for her brains just as much as her hands. The head chef is figuring out the menu and how to combine all of the ingredients. She is involved very heavily with what the final result is going to be. A head chef has to think of the broader goals and strategy of the restaurant, not just how to get the immediate task done.

M is the Sous Chef; DAX is the Head Chef

Again this is all a gross generalization, but in the restaurant called Casa De Meidinger this is actually the case! I do a lot of the grunt work when we cook a meal. My wife says, “zest this lemon” and I mindlessly do it. I could probably be replaced with a robot some day, and that would be fine by me.

Annie, however, actually enjoys planning a meal, deciding what to cook, and thinking about how to make the final product. To me, cooking is just a necessary evil for eating. I don’t necessarily get any joy from the process itself.

Working with M

I like to think of M as this sous chef. It does all the grunt work that we’l like to automate. Let’s say that my boss asks for a utilization report for all of the technicians. What steps am I doing to do in M?

  1. Extract the data from the line of business system
  2. Remove extraneous columns
  3. Rename columns
  4. Enrich the services table with a Billable / NonBillable column
  5. Generate a date table

This is all important work, but I would have to do the same work for a variety of reports. Many of the steps tell me nothing about the final product. I would generate a date table for most of my reports, for example.

Working with DAX

Now, if I’m working DAX, what am I going to do?

  1. Ask what the heck “utilization” really means

This was a real-life example that happened to me. What is utilization as a key metric? Well it turns out it depends what you are trying to report on. A simple definition is usage divided by availability. If a technician billed 20 hours and clocked in 40, his utilization would be 50%. Or so you would think.

How do we handle internal projects? Let’s say we have a technician who billed 2 hours to a customer, but spent 38 hours on an internal database migrations. What was his utilization?Well, if we are looking for billable utilization, it’s 5%. If we are looking for total utilization, it is 100%. These are questions that you are going to encapsulate in your DAX formulas.

The whole idea of a BI semantic layer is to hide away the meaning from the end users. When someone orders a cobb salad, they don’t want to have to articulate the ingredient list. They just want a darn salad.

Are you paid for your hands or your brain?

In the SQL Data Partners podcast, episode 114, there was a question: what’s the difference between a contractor and a consultant. One of the answers was this: a contractor is a set of hands, and a consultant is a set of brains.

I think this answer relates to M versus DAX. M is an automated set of hands, able to do work you’d normally do by hand in Excel. DAX let’s you take your domain knowledge and encode it into a data model. It’s an externalized representation for your brain.

And if you think about it, which do you want to be paid for? Do you want to get paid to unpivot data by hand every week? Or do you want to get paid for thinking, for understanding the business and for working at a higher level.

M allows you to automate the first step, so you can do more of the latter with DAX.

Why DAX is a PITA: part 1

  • So, I think that DAX is a pain in the butt to use and to learn. I talk about that in my intro to DAX presentation, but I think it boils down to the fact that you need a bunch of mental concepts to have a proper mental model, to simulate what DAX will do. This is very deceptive, because it looks like Excel formulas on steroids, but conceptually it’s very different.

Here is the problem with DAX, in a nutshell:

image

This example below is a perfect example of that sharp rise in learning curve, and dealing with foreign concepts like calculated columns, measures, applied filters, and evaluation contexts.

So, one of the things I’m hoping to catalog are example where DAX is a giant pain if you don’t know what you are doing. People make it look really simple and smooth, and that can be frustrating sometimes. Let’s see more failures!

How do I GROUPBY in DAX?

John Hohengarten asked me a question recently on the SQL Community Slack. He said:

I need to sum an amount column, grouped by a column
Measure 1 :=
GROUPBY (
det,
det[nbr],
    “Total AR Amt Paid calc”SUM ( det[amt] )
)
I’m getting a syntax error

So automatically, something seemed off to me. Measures are designed to return a single value, given the filter context that’s applied to them. That means you almost always need some aggregate function at an outer level. But based on the name, you wouldn’t necessarily expect GROUPBY to return a single value. It would return values for each grouping instance.

If we take a look at the definition for GROUPBY(), we see it returns a table, which makes sense. But if you are new to DAX, this is really unintuitive because DAX works primarily in columns and tables. This is a really hard mental shift, coming from SQL or Excel.

 What do you really want?

None of this made any sense to me. Why would you try to put a GROUPBY in a measure? That’s like trying to return an entire table for a KPI on a dashboard. It just doesn’t make sense. So I asked John what he was trying to do.

He sent me an image of some data he was working with. On the far left is the document id and on the far right is the transaction amount.
Pasted image at 2017_07_06 09_28 AM

He wanted to add another column on the right, that summed up all of the amounts for transactions with the same document. In SQL, you’d probably do this using a Window function with a SUM aggregate, like here.

 Calculated columns versus measures

This highlights another piece of DAX that is unintuitive. You have two ways of adding business logic: calculated columns and measures. The both use DAX, both look similar and are added in slightly different spots.

But semantically and technically, they are very different beasts. Calculated columns are ways of extending the table with new columns. They are very similar to persisted, computed columns in SQL. And they don’t care at all about your filters or front-end, because the data is defined at time of creation or time of refresh. Everything in a calculated column is determined long before you are interacting with them.

Measures on the other hand, are very different. They are kind of like custom aggregate functions, like if you could define your own version of SUM. But to carry the analogy, it would be like if you had a version of SUM that could manipulate the filters you applied in your WHERE clause. It gets weird.

My point is, if you don’t grok the difference between calculated columns and measures, you will never be able to work your way around the problem. You will be forced to grope and stumble, like someone crawling in the dark.

Filter context versus row context

So in this case we’ve determined we actually want to extend the table with a column, not create a free-floating measure. Now we run headlong into our next conceptual problem: evaluation contexts.

In DAX there are two types of evaluation contexts: row contexts and filter contexts. I won’t go too deep here, but they define what a formulas can “see” at any given time, and in DAX there are many ways to manipulate these contexts. This is how a lot of the time intelligence stuff works in DAX.

In this case, because we are dealing with a calculated column, we have only a row context, not filter context. Essentially, the formula can only see stuff in the same row. Additionally, if we use an aggregate like SUM, it only cares about the filter context. But the filter context comes from user interaction. Because this data is defined way before that, there is no filter context.

This is another area, where if you don’t understand these concepts you are SOL. Again, for the newbie, DAX is a pain.

 What’s the solution?

So what is the ultimate solution to his problem? There are probably better ways to do it, but here is a simple solution I figured out.

SUM =
CALCULATE (
    SUM ( Source_data[Amount] ),
    ALL ( Source_data ),
Source_data[Document] = EARLIER ( Source_data[Document] )
)

Walking through it, The CALULATE is used to turn our row context, into a filter context. Then it manipulates that filter context so SUM “sees” only a certain set of rows.

The first manipulation is to run ALL against the table, to undo any filters applied to it. In this case, the only filter is our converted row context. (confused yet?)

The next manipulation is to use EARLIER (which is horribly named) to get the value from the earlier row context. In this case we are filtering ALL the rows, to all of them that have the same document. Then, finally we apply the SUM, which “sees” the newly filtered rows.

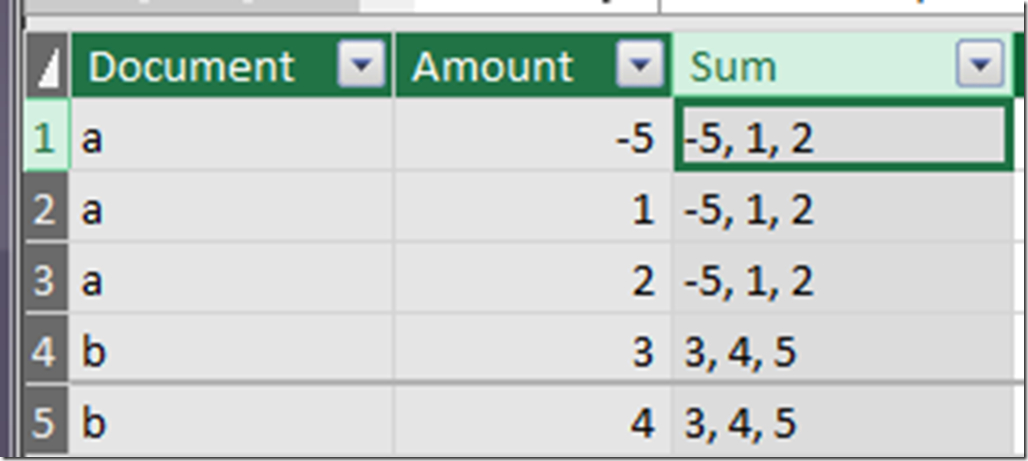
Here is what we get as a result:

image

 How do we verify that?

A fourth pain with DAX is that it’s very hard to look at intermediate stages of a process, like you can with SQL or Excel formulas, but in this case we have a way. If we convert our SUM to a CONCATENATEX, we can output all the inputs as a comma separated list. This gives us a slightly better idea of what’s going on.

image (1)

 What’s the point?

My point is, that DAX, despite it’s conciseness and richness is hard to start using. Even basic tasks can require complex concepts, and that was a big frustration point for me. You can’t just google GROUPBY and understand what’s going on.

Again, check out my presentation I did for the PASS BI virtual group. I tried to cover all the annoying parts that people new to DAX will run into. That and buy a book! you’ll need it.