Monthly Archives: November 2018

Why is Power BI Free?

Something that some people search for is the question “Why is Power BI Free?”. Power BI is free because it benefits Microsoft to have an easy on-ramp to Power BI and to attract as large an audience as possible. It is in their financial interest.

If you are wondering what the catch is, the catch is that the free version of Power BI has very limited sharing capabilities, among other features.

In this post, I’m going to cover some reasons why Microsoft would make Power BI free. But before we can elaborate on all of that, we need to clarify what we mean by “free”. Read my post from last week for more details.

So why is it free?

So why would it behoove Microsoft to provide a limited free version of Power BI? Some ideas come to mind:

  • People can learn for free. This is important since Microsoft is aiming for a broader audience instead of a deeper one. The main target audience for Power BI is the everyday business user, not BI developers.
  • People are skeptical. It can be hard to convince a business to make a large investment in a BI product. By having a free version, a small group of people can do a pilot project without spending any money.
  • Razors-and-blades sales model. Companies will often sell products at a loss or give them away for free, if there is a paid compliment needed to take advantage of that product. Think about how cheap printers are, but how expensive ink is, for example.
  • SaaS is where they make their money. Related to the previous item, Microsoft makes a lot of their money these days from subscriptions. It used to be that they primarily sold software as standalone packages. But in the last few years, they are making more and more money from  Saas like Office 365, or cloud computing like Azure. Power BI fits neatly into that space.
  • Free dashboards are good marketing. Some people will make really cool and innovative dashboards and then share them publicly. This doesn’t detract from Microsoft’s business model at all. Free users are free marketing.

Overall, Power BI is free because so much of the real value comes from the enterprise collaboration and sharing. You can make beautiful visuals with a lot of tools, but few compare to the IT Governance story that Microsoft has.

Is Power BI free?

Power BI Desktop, the authoring tool, is completely free to use. Users can also create free accounts on the Power BI service, with a number of restrictions. In short, Power BI  is free to get started, but if you want to do any serious professional work you are going to have to pay for a license.

Some pieces of Power BI are free and some aren’t. Parts that are available for free:

  • Power BI Desktop
  • Power BI Service (with limitations)
  • Power BI Mobile

Parts that are not available for free:

  • Enterprise sharing and collaboration
  • Power BI Report Server
  • Power BI Premium

Which parts are actually free?

Power BI Desktop

First there is the report authoring tool, known as Power BI Desktop. This tooling is completely free to use.

image_thumb1

(PBIX file credit of Microsoft. Available here.)

You will have to either create an account or deal with some mild nagging about signing up for a mailing list. You can disable that nagging with a registry change.

image

While Power BI Desktop is a great authoring tool, it is a terrible collaboration tool. If you were to live entirely in PBI Desktop, you’d have to pass around PBIX files which is incredibly clunky.

In my opinion, if you are going to look at using an on-premises, self-service tool you are better off using Excel. You still get a lot of the same capabilities with Power Query and Power Pivot, but inside of a tool people understand, and a tool Office 365 can render online.

Power BI Service

The Power BI Service, think powerbi.com, allows for free users. These free users can create reports and upload them, but with a significant number of limitations. The biggest is you only have one way of sharing content to others. Specifically with Publish to Web, which essentially makes your entire report free to the public.

You also only have one way of privately consuming other people’s reports, and that’s if someone places content in Power BI Premium. Otherwise, other users can’t share their reports directly with you. Power BI Free users are truly and island to themselves.

One other thing worth nothing is that you can’t sign up with a personal email. David Eldersveld has a good blog post on the issue. As of this writing, the uservoice request to change this has 2,800 votes.

See here for some more limitations of the free version of Power BI.

Power BI Mobile

Power BI Mobile is a way to consume Power BI Reports on Apple, Android and Windows mobile devices. Here is a picture of Power BI Mobile on my phone.

Screenshot_20180917-111943

Which parts aren’t free?

Enterprise sharing and collaboration

Power BI is, by design, a collaboration tool. It is designed for people to publish and share their reports. If you want to take advantage of content curation using app workspaces, you’ll need to pony up and pay for a Power BI pro license.

If you are doing any real work with Power BI, you are going need to pay for a license for yourself as well as any report consumers.

Power BI Report Server

In addition to Power BI Pro, there is Power BI Report Server, which is the on-premises solution for hosting Power BI Reports. If you decide to go with Power BI Report server instead of making use of the Power BI Service, then you are going to need to pay for SQL Server Enterprise as well as Software Assurance. Alternatively you could pay for Power BI Premium.

Power BI Premium

Power BI premium is an alternate licensing model where you are licensing the content instead of the users. Once you have 500 or more users, it starts to make sense. Until then, the $5,000 per month is pretty pricey.  It has other benefits as well, such as paginated reports and incremental refresh.

Summary

Some parts of Power BI is Free, but once you want to share with others, use more advanced features, or alternate deployment options, you are going to have to start paying.

How I deal with depression

Content warning: depression, suicide

Matthew Roche recently blogged about his struggles with mental illness. I applaud his courage, because it’s easy to worry what people will think about you. More recently, a member of the SQL Community took her life, and frankly the thought scares the shit out of me. It scares me, because some day that could be me. In fact, it’s been a recent point of discussion with me and my wife.

I write this post because I hope that if you are struggling with these feelings, you will get help. Please do something, because there are people that love you and would be devastated if you left this world. Here is what depression looks like and what I do to stave it off.

What is depression?

The English language does us a disservice in that the word for what is a crippling mental illness is the same word we use casually for being bummed out or sad. And while there is a spectrum, with there being things such as dysthymia or anhedonia (lack of pleasure), depression is often accompanied with what are called cognitive distortions.

If you think “I’m a failure”, that is a cognitive distortion, that is just factually wrong. You may have failed at a thing, but we are multifaceted, changing people. Depression is a matter of being disconnected with the reality at hand.

So what does the difference look like? We all get sad sometimes. Sadness is a good thing, grief is a good thing. These are healthy responses to difficulties in life. Victor Frankl, when writing about being in a concentration camp wrote, “An abnormal reaction to an abnormal situation is normal behavior” . To never feel sadness or grief would be abnormal.

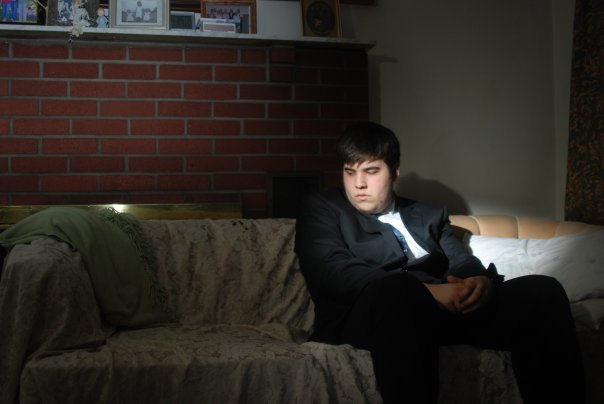
Here is a picture of what healthy grief looks like:

Depression is very different. It is an auto-immune disorder of the mind. It is very commonly accompanied with negative thoughts that are pervasive, persistent and pessimistic. Common themes are feelings of helplessness, hopelessness, worthlessness, and suicidal ideation.

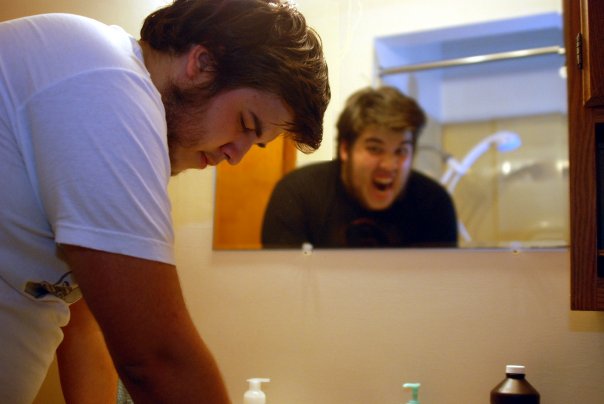
Here is a picture of what depression feels like:

If you are uncertain if you are depressed, take this depression checklist. It’ll take 5 minutes and may reveal something you are uncomfortable admitting. I took it just took it now, and today I am a 14 out of 100, or mild depression. There have been days when it’s been in the mid 30’s, or moderate depression.

Open Source Mental Health performed a survey of 1570 people in technology.  Of those who answered the questions, 78% indicated they had a mental illness and around 70% of those indicated that they had a mood disorder such as depression or bipolar. We work in a field that often requires us to be on call or can make stressful demands on our lives. It’s more common than you might think.

It needs treated

I have a disease that requires daily treatment and medicine. My body doesn’t produce the chemicals I need. If I don’t treat it on a regular basis and monitor myself, someday I might die. That disease is called diabetes.

That’s right, I take insulin because my body stopped producing it years ago. I don’t think of myself of weak or less than because my body doesn’t work the way it should. Depression is often the same. Something has gone wrong in the brain. It could be a chemical imbalance, traumatic childhood events, or just a naturally lower set point for mood.

Whatever the cause, it still needs treated. It can be hard to admit and feel like a failing. I’m a guy, and I hate, hate, hate feeling like a burden to anyone. I hate asking for help. So much so, that when I was diagnosed with diabetes in the hospital, I told my now wife that I’d understand if she broke up with me. She just about slapped me. Boy was I dumb.

Get help. Please.

How I treat depression

Here are the ways I treat my depression:

Medication. Every single day, I take 10mg of Lexapro. I avoided it for a long time, I’ve heard horror stories about psych meds. I tried everything else, but eventually I decided I needed to take medicine.

The first month was hell and it takes 6 weeks to kick in. I had dry mouth and wanted to crawl out of my skin. After that my body acclimated, and the bleaker side of depression went away. I didn’t feels as dark and lethargic and hopeless. I still had negative thoughts and burnout, but I didn’t feel hopeless anymore. Many people have to try multiple medications to find one that works for them.

Exercise. The second most effective thing I’ve found to treat my depression is exercise, especially cardio exercise. I have to exercise every day, even if I’m sick. If I go a week without getting exercise, I start to get a resumption of symptoms. Exercise is as important as any of my other medications.

Sleep. Sleep is massively critical to good mental health. Sometimes I track my negative thoughts using a tally counter. A bad night’s sleep can double the number of negative thoughts I have in a given day. You wouldn’t give a SQL server 4 gigs of ram, why would you give your brain 4 hours of sleep and expect it to function properly.

Light. I hate the winters in Pittsburgh. It’s dark when you leave for work and it’s dark when you come home. I feel my symptoms most severely during the winter time. To deal with that I have lights everywhere. I have light alarm clocks, I have blue therapy lights to blast 1000 lux at my eyes and wake me up. I’ve even put hue lights in my room so my whole room lights up in the morning. The most effective thing is to just go outside, however.

Cognitive Behavioral Therapy. One of the most effective therapies is Cognitive Behavior Therapy. In short it identifies that it’s not just events that cause our emotional reactions, but also our beliefs about them. If you partner, come home late you could happy or sad depending on your beliefs.

CBT can be learned from books and I’ve found it to be effective. It feels a lot like having to catch your negative thoughts and then do a complex algebra problem, but I’ve gotten much better at labeling my automatic negative thoughts.

Meditation. Something new I’m trying is meditation. Those negative thoughts, or ruminations, can be hard to catch sometimes. They are like little mosquito bites. Independently, very small. But if you have 150 mosquito bites in a day, they add up. Meditation helps me catch myself and implement the CBT. I use the 10% Happier app and recommend the audio book. It’s fantastic and totally secular, if that’s your preference.

Biofeedback. Sometimes I count my negative thoughts with a physical tally counter. I think this week it was something like 30 -> 26 -> 22 -> 6 -> 7 -> 5 . I’ve had days where is was between 100 and 200. That’s a negative thought every few minutes.

I found that when I actually count them, I make more of an effort to catch myself and think healthier thoughts. Instead of thinking “I’m a failure” I think “I feel embarrassed.” Instead of thinking, “I hate myself”, I think “I feel scared and socially anxious.”

Social interaction. Depression is an isolating disease and IT can be an isolating job. Social interaction get’s us out of our heads and can be a source of support. Even just being at the library and near people can be helpful.

Talk therapy. While I’m not currently in therapy, I was for a while. I found it useful to be in a non-judgmental environment and have someone else I could bounce things off of.

Summary

While I have been in no way cured, there are a number of things I do to treat myself. There are a multitude of options you can take and a plethora of resources out there. Some of them may not work, but many of them are worth trying.

Power BI Learning Path – Free and Paid Resources

how to keep up with technology. When you are starting out with a technology, it’s just plain hard to get a lay of the land.

So, I thought I’d put together a learning path for Power BI, a technology that changes literally every month. This is a bit of challenge because there are so many moving parts when it comes to Power BI. Accordingly, let’s break down those moving parts into different categories.

image

So, when I think about Power BI, I like to think about the flow of data. First we have the Data prep piece with Power Query, where we clean up dirty data. Next we model the data with DAX. I’ve written before about the difference between Power Query and DAX. They are like peanut butter and jelly and compliment each other well.

Now, if you are a SQL expert, you may not need to worry about Power Query or DAX much. Maybe you do a lot of the work in SQL. But either way, once your data is modeled, you need to visualize it in some way. You need to learn how to create your reports with Power BI Desktop. Once your report is created, you then need to publish it.

Finally, there is what I would call the IT Ops side of Power BI. You have to install an on-premises data Gateway to access local data. You need to license your users. You need to lock down security. All of these things might be outside of what a normal BI developer has to deal with, but are still important pieces. However, unlike the data flow model we talked about, the ops pieces happens at all of the stages of development and deployment.

With that overview in place, let’s get on to the individual sections and the learning paths as a whole.

Getting started with Power BI

When it comes to getting started with Power BI, I have two recommendations. First get your hands dirty, and secondly buy a book. Power BI is in many ways an amalgamation of disparate technologies. It took me a long time to to understand it and it didn’t really click until I took the edX course and did actual labs.

The reason I say to buy a book is this is a technology that is hard to learn piecemeal. When you are starting out you are much better off having a curated tour of things.

Free resources

  • Check out Adam Saxton’s getting started video.
  • Search Youtube for Dashboard in an Hour. This is a standardized presentation that will show you the basics in under an hour.
  • Follow the guided learning. This will walk you through bite sized tasks with Power BI.
  • Take the edX course. It has actual labs where you have to work with data inside of Power BI.
  • Check out the Introducing Microsoft Power BI book from Microsoft Press. It’s a bit dated at this point, but it’s free and is a great start.
  • Check out the Power BI: Rookie to Rockstar book from Reza Rad (b|t). The last update was July 2017, but it’s also very comprehensive and good.

Paid resources

  • Stacia Misner Varga (b|t) has a solid course on Pluralsight. It’s worth a watch.
  • Consider reading the Applied Power BI by Teo Lachev (b|t). It’s a real deep dive which is great, but can be a lot to take in if you are just getting started. A neat feature is that it’s organized by job role.

Learning Power Query and M

When it comes to self-service data preparation, Power Query is THE tool. The way I describe it is as a macro language for manual data manipulations. If you can pay someone minimum wage to do it in Excel, you can automate it in Power Query. Again, check out this post for the differences between Power Query and DAX.

Free Resources

  • Start with the guided learning. This quickly covers the basics
  • Reza Rad has a solid getting started post on Power Query that you can follow along with.
  • Matt Masson has a phenomenal deep dive video on the Power Query formula language, a.k.a M, from a year ago. It really helps elucidate the guiding principals of Power Query and M.
  • Blogs to check out:
    • Imke Feldmann (b|t) regularly has complex functions and interesting transformations on her blog.
    • Ken Puls (b|t) focuses on Excel and along with that, Power Query.
    • Gil Raviv (b|t) often has neat examples of things you can do with Power BI and Power Query.
    • Chris Webb (b|t) regularly dives into the innards of Power Query and what you can do with it.

Paid Resources

  • Ben Howard (b|t) has a Pluralsight course on Power Query. It’s a bit introductory, but great if you are just getting started.
  • Gil Raviv recently (October 2018) released a book on Power Query. What I really like about this book is it has more of a progression style instead of a cookbook kind of feel.
  • Ken Puls and Miguel Escobar (b|t) also have a book on Power query that has a cookbook feel. I found it helpful in learning Power Query, but it’s heavily aimed at excel users.
  • Finally, Chris Webb also has a book on Power Query. He goes into a lot of detail with it. However, the 2014 publish date means it’s starting to get a bit old.

Learning DAX

I always say that DAX is good at two things: aggregating and filtering. You aren’t doing those two things, then DAX is the wrong tool for you. DAX provides a way for you to encapsulate quirky business logic into your data model, so that end users doing have to worry about edge cases and such.

Free Resources

  • Read the DAX Basics article from Microsoft
  • Check out the guided learning on DAX
  • Learn the difference between Calculated columns and Measures in DAX. They can be confusing.
  • Make sure you understand the basics with SUM, CALCULATE and FILTER
  • Understand Row and Filter contexts. They are critical for advanced work in DAX
  • Blogs to check out
    • Matt Allington (b|t) has a blog with Excel right in the name but also writes about all the different parts of Power BI Desktop.
    • Rob Collie (b|t) has a voice all his own. read his blog to learn about DAX and PowerPivot without taking yourself too seriously.
    • Alberto Ferrari (b|t) and Marco Russo (b|t) are THE experts on DAX. Read their blog. Also see their site DAX.guide.
    • Avi Singh (b|t) regularly posts videos on Power BI and will often take live questions.

Paid Resources

Power BI Visuals

The piece of Power BI that is most prominent are they visuals. While it’s incredibly easy to get started, I find this area to be the most difficult. If you are heavily experience in reporting this shouldn’t be too difficult to learn.

Free resources

Paid resources

  • A really interesting book is The Big Book of Dashboards. While it doesn’t mention Power BI, it covers all the ways to highlight data and what really makes a dashboard.

Administering Power BI

Power BI is much more than a reporting tool. It is a reporting infrastructure. This means at some point you may have to learn how to administer it as well.

Free resources

Paid resources

Keeping up with Power BI

One of the big challenges with Power BI is just keeping up. They release to new features each and every month. Here are a few resources to stay on top of things:

Going Deeper

Finally, you may want to go even deeper with things. Here are some final recommendations:

I’m starting a BI newsletter. 5 BI links every week.

I’ve written before about how to keep up with technology. In the post, I describe 3 currencies we can spend to extend out learning: time, focus and actual money. As you get older, you start to get less time and even less focus, but your pay rate goes up. So, every year it becomes more and more important to learn on curation to find just the good stuff.

As part of that I’m starting my own curated mailing list for BI links. Power BI changes on a monthly basis and it’s such a pain to keep up with it. This week is the 3rd week so far.

So what’s the catch? Well, I’ll also be including whatever things I’m up to at the bottom of each email. So if you don’t like me, maybe don’t sign up, hah. Here is this week’s weekly BI 5:

  1. David Eldersveld talks a bit about #MakeoverMonday. This sounds like a great community program and I always find making things pretty to be the hardest part.
  2. Wolfgang Strasser is keeping track of all the November updates for Power BI. I keep seeing memes about this from Microsoft employees, so I’m expecting something big to drop at Pass Summit.
  3. Ginger Grant continues her series on SSAS best practices. I love seeing posts about how to do things right instead of just how to do the basics. Great stuff.
  4. Chris Webb also my conspiracy theories about where Power BI is going. Also keep an eye out for announcements about data flows.
  5. Finally, If you are going to PASS Summit, check out the BI Power Hour. All learning will be accidental.

Sign up to the list today!