Category Archives: Power BI

Power BI Learning Path – Free and Paid Resources

how to keep up with technology. When you are starting out with a technology, it’s just plain hard to get a lay of the land.

So, I thought I’d put together a learning path for Power BI, a technology that changes literally every month. This is a bit of challenge because there are so many moving parts when it comes to Power BI. Accordingly, let’s break down those moving parts into different categories.

image

So, when I think about Power BI, I like to think about the flow of data. First we have the Data prep piece with Power Query, where we clean up dirty data. Next we model the data with DAX. I’ve written before about the difference between Power Query and DAX. They are like peanut butter and jelly and compliment each other well.

Now, if you are a SQL expert, you may not need to worry about Power Query or DAX much. Maybe you do a lot of the work in SQL. But either way, once your data is modeled, you need to visualize it in some way. You need to learn how to create your reports with Power BI Desktop. Once your report is created, you then need to publish it.

Finally, there is what I would call the IT Ops side of Power BI. You have to install an on-premises data Gateway to access local data. You need to license your users. You need to lock down security. All of these things might be outside of what a normal BI developer has to deal with, but are still important pieces. However, unlike the data flow model we talked about, the ops pieces happens at all of the stages of development and deployment.

With that overview in place, let’s get on to the individual sections and the learning paths as a whole.

Getting started with Power BI

When it comes to getting started with Power BI, I have two recommendations. First get your hands dirty, and secondly buy a book. Power BI is in many ways an amalgamation of disparate technologies. It took me a long time to to understand it and it didn’t really click until I took the edX course and did actual labs.

The reason I say to buy a book is this is a technology that is hard to learn piecemeal. When you are starting out you are much better off having a curated tour of things.

Free resources

  • Check out Adam Saxton’s getting started video.
  • Search Youtube for Dashboard in an Hour. This is a standardized presentation that will show you the basics in under an hour.
  • Follow the guided learning. This will walk you through bite sized tasks with Power BI.
  • Take the edX course. It has actual labs where you have to work with data inside of Power BI.
  • Check out the Introducing Microsoft Power BI book from Microsoft Press. It’s a bit dated at this point, but it’s free and is a great start.
  • Check out the Power BI: Rookie to Rockstar book from Reza Rad (b|t). The last update was July 2017, but it’s also very comprehensive and good.

Paid resources

  • Stacia Misner Varga (b|t) has a solid course on Pluralsight. It’s worth a watch.
  • Consider reading the Applied Power BI by Teo Lachev (b|t). It’s a real deep dive which is great, but can be a lot to take in if you are just getting started. A neat feature is that it’s organized by job role.

Learning Power Query and M

When it comes to self-service data preparation, Power Query is THE tool. The way I describe it is as a macro language for manual data manipulations. If you can pay someone minimum wage to do it in Excel, you can automate it in Power Query. Again, check out this post for the differences between Power Query and DAX.

Free Resources

  • Start with the guided learning. This quickly covers the basics
  • Reza Rad has a solid getting started post on Power Query that you can follow along with.
  • Matt Masson has a phenomenal deep dive video on the Power Query formula language, a.k.a M, from a year ago. It really helps elucidate the guiding principals of Power Query and M.
  • Blogs to check out:
    • Imke Feldmann (b|t) regularly has complex functions and interesting transformations on her blog.
    • Ken Puls (b|t) focuses on Excel and along with that, Power Query.
    • Gil Raviv (b|t) often has neat examples of things you can do with Power BI and Power Query.
    • Chris Webb (b|t) regularly dives into the innards of Power Query and what you can do with it.

Paid Resources

  • Ben Howard (b|t) has a Pluralsight course on Power Query. It’s a bit introductory, but great if you are just getting started.
  • Gil Raviv recently (October 2018) released a book on Power Query. What I really like about this book is it has more of a progression style instead of a cookbook kind of feel.
  • Ken Puls and Miguel Escobar (b|t) also have a book on Power query that has a cookbook feel. I found it helpful in learning Power Query, but it’s heavily aimed at excel users.
  • Finally, Chris Webb also has a book on Power Query. He goes into a lot of detail with it. However, the 2014 publish date means it’s starting to get a bit old.

Learning DAX

I always say that DAX is good at two things: aggregating and filtering. You aren’t doing those two things, then DAX is the wrong tool for you. DAX provides a way for you to encapsulate quirky business logic into your data model, so that end users doing have to worry about edge cases and such.

Free Resources

  • Read the DAX Basics article from Microsoft
  • Check out the guided learning on DAX
  • Learn the difference between Calculated columns and Measures in DAX. They can be confusing.
  • Make sure you understand the basics with SUM, CALCULATE and FILTER
  • Understand Row and Filter contexts. They are critical for advanced work in DAX
  • Blogs to check out
    • Matt Allington (b|t) has a blog with Excel right in the name but also writes about all the different parts of Power BI Desktop.
    • Rob Collie (b|t) has a voice all his own. read his blog to learn about DAX and PowerPivot without taking yourself too seriously.
    • Alberto Ferrari (b|t) and Marco Russo (b|t) are THE experts on DAX. Read their blog. Also see their site DAX.guide.
    • Avi Singh (b|t) regularly posts videos on Power BI and will often take live questions.

Paid Resources

Power BI Visuals

The piece of Power BI that is most prominent are they visuals. While it’s incredibly easy to get started, I find this area to be the most difficult. If you are heavily experience in reporting this shouldn’t be too difficult to learn.

Free resources

Paid resources

  • A really interesting book is The Big Book of Dashboards. While it doesn’t mention Power BI, it covers all the ways to highlight data and what really makes a dashboard.

Administering Power BI

Power BI is much more than a reporting tool. It is a reporting infrastructure. This means at some point you may have to learn how to administer it as well.

Free resources

Paid resources

Keeping up with Power BI

One of the big challenges with Power BI is just keeping up. They release to new features each and every month. Here are a few resources to stay on top of things:

Going Deeper

Finally, you may want to go even deeper with things. Here are some final recommendations:

I’m starting a BI newsletter. 5 BI links every week.

I’ve written before about how to keep up with technology. In the post, I describe 3 currencies we can spend to extend out learning: time, focus and actual money. As you get older, you start to get less time and even less focus, but your pay rate goes up. So, every year it becomes more and more important to learn on curation to find just the good stuff.

As part of that I’m starting my own curated mailing list for BI links. Power BI changes on a monthly basis and it’s such a pain to keep up with it. This week is the 3rd week so far.

So what’s the catch? Well, I’ll also be including whatever things I’m up to at the bottom of each email. So if you don’t like me, maybe don’t sign up, hah. Here is this week’s weekly BI 5:

  1. David Eldersveld talks a bit about #MakeoverMonday. This sounds like a great community program and I always find making things pretty to be the hardest part.
  2. Wolfgang Strasser is keeping track of all the November updates for Power BI. I keep seeing memes about this from Microsoft employees, so I’m expecting something big to drop at Pass Summit.
  3. Ginger Grant continues her series on SSAS best practices. I love seeing posts about how to do things right instead of just how to do the basics. Great stuff.
  4. Chris Webb also my conspiracy theories about where Power BI is going. Also keep an eye out for announcements about data flows.
  5. Finally, If you are going to PASS Summit, check out the BI Power Hour. All learning will be accidental.

Sign up to the list today!


The many tentacles of Power BI; or, Microsoft’s not-so-secret plan to take over the world.

Three years ago, I started learning about Power BI and I thought, “Man, this is a really crappy replacement for SSRS.” Three years later, that’s still true, it’s a crappy replacement for SSRS. But that’s missing the point. Microsoft’s ambitions are MUCH, MUCH bigger than replacing SSRS.

Let’s review the many tentacles of Power BI; or, Microsoft’s not-so-secret plan to take over the world.

Tentacle 1 – SQL Server

It is unsurprising that Power BI is often compared to SSRS. If you come from a SQL background, there is a good chance that you need to report on the data in your database in some way. While there are a multitude of tools available to do so, often it’s easiest to go with whatever Microsoft recommends. You already paid for it, right?

For many years, that was SSRS. And for half a decade, between 2010 and 2016, not much changed with SSRS. Much like some of the plants at the Phipps conservatory, it wasn’t dead…just dormant.

“I’m Not Dead, I’m Dormant” T-Shirt

So what changed around 2016? A couple of things. First, Microsoft acquired Datazen which would later turn into SSRS mobile reports. Second, Microsoft rebuilt the SSRS rendering engine to take advantage of HTML 5. Third, there was a new kid on the block: Power BI.

If you come from the SQL world, this is all old hat by now. Microsoft is investing a lot of time and money into Power BI, so it’s tempting to think that Power BI is replacing SSRS, but it isn’t. If we look at the traditional BI pyramid, Power BI and SSRS occupy two totally different strata.

image

SSRS is designed for things that need a page number on them. This is generally detail-heavy, pixel perfect kind of work. This kind of operational reporting is descriptive, it tells you facts, but doesn’t add a lot of spin. This is at the base of the pyramid

Once we have the business up and running, we can move from “is” to “ought”. What should we do? Where should we go? This kind of reporting is higher-level, less detail oriented. You are looking at the company as a whole or at multiple years of history. You may drill down deeper, but generally speaking someone else is sweating the small stuff. This kind of reporting is prescriptive and where we find Power BI.

Finally, once we are moving and we are moving in the right direction, we can be even more forward looking and make use of predictive analytics. What’s going to happen in the future? What can the data tell us? This is where tools like Azure Machine learning and R can start to help us.

Power BI and SSRS are aligning

Power BI and SSRS are aligning and getting closer. If Power BI was a drop-in replacement, I wouldn’t expect to see this. I would expect to see Microsoft heavily pushing one over the other and that’s it.

By contrast, look at SSAS tabular and multidimensional modes. Tabular is available in Azure Analysis Services and multidimensional mode isn’t. Yes, I know it’s on the roadmap but it’s definitely not a number one priority. Every time I hear about SSAS, people are talking about tabular mode. In economic terms, DAX and MDX are subsitute goods. Sales of one reduces sales of the other. Think Coke versus Pepsi.

Power BI and SSRS, on the other hand, are complimentary goods. Think peanut butter and jelly. Yes, they are both things you can put on your bread, but they go better together. Yes, I know that seems strange, but look at what’s going on.

Last year, they announced Power BI Report Server, which is basically SSRS server with Power BI rendering on top. This year they announced SSRS rendering in Power BI Premium. Now, whether you are on-premises or in the cloud you use Power BI and SSRS in the same place.

Give it another year, and I bet the alignment is going to get even closer. I bet they will add Power Query as a data input for SSRS, just you wait and see.

Tentacle 2 – CRM, ERP, and business data

Microsoft wants your business data and it wants it badly. Last week I spoke at the Phoenix Power Summit, and I was really out of my element because it was all about business. It was basically 5 conferences in one, focusing mainly on all of the dynamics products (AX, NAV, Great Plains and Dynamics 365).

It was strange walking around the 250 vendors and 4,000 other attendees. Out of everyone there I only knew 2 people. And what those 4,000 people represented was something that I had never fully considered: standing there was Power BI’s core audience. It’s not me and it’s probably not you. It’s Chris in accounting. Let’s meet Chris.

Say hi to Chris

When I first learned about Power BI I was confused. Why did I need Power Query? Why did I need DAX? I already had all this stuff. I had T-SQL and SSIS. And the truth was, those tools weren’t for me, they were for Chris.

So much of this stuff clicked when I came up with the persona of Chris in accounting. This is the kind of person who is great at vlookups, okay at SQL and is stuff in the land of spreadmarts, flat files and Access databases. This person understands the business intricately and just wants to get things done. And many time, she has almost no IT support to get her job done, so she has to make do with the tools she has. For her, Power BI is a life saver.

And walking around me last week was 4000 Chris-es from accounting. This is going to be big.

Microsoft shoots across the bow of Salesforce

It doesn’t take a genius to realize that Microsoft and Salesforce are direct competitors. Both were interested in buying Linkedin, and more recently Microsoft fired a warning shot to Salesforce.

At Ignite, Satya announced the open data initiative along with Adobe and SAP. Guess who isn’t in the picture? That’s right, it’s Salesforce.

Image result for ignite open data initiative

Part of that announcement was them talking about the Common Data Service. When I first heard about CDS months ago, I was again confused. It sounded like some weird semantic layer for the data in Dynamics CRM. Maybe useful if your data lives in Dynamics 365, otherwise who the heck cares.

Oooooh boy was I wrong. Microsoft is aiming for something much, much more ambitious than an awkward pseudo-database layer for people who don’t like SQL. They are aiming for a common shape for all of your business data. They want to want to create a lingua franca for all of your business data, no matter where it is. Especially if it’s hiding in Salesforce.

Now, do I expect them to succeed? I’m not sure. I’ve learned the hard way that every business is a unique snowflake, even two business in exact same industry. But if anyone can do it, Microsoft has a good shot. They’ve been buying up CRM / ERP solutions for decades.

Tentacle 3 – Data Science, Machine learning and Azure

Last week I had the pleasure of attending the Phoenix SQL user group and listen to Matthew Roche talk about Power BI Dataflows. When I first heard about dataflows, like everything else in this space, I didn’t quite get it. It sound like Power Query, but for the Power BI Service directly? Weird.

The way Matthew described it made a lot of sense. Dataflows represent an intermediate layer for your data, much like a traditional data warehouse. This is after all of the boring ETL bits, but before all of the sexy BI semantic layer bits. This is, metaphorically, chopping all your broccoli and putting it into plastic bags. The end user still has to decide what the final product looks like.

And guess what shape they let you put your data into? That’s right, the common data service. Microsoft wants to act like as a clearing house for your data. They want to act as a middle man for all of your data sources and all of your data consumption.

Bigger ambitions

My favorite slide from Matt’s presentation is this one. (Courtesy of James Serra).

One weird thing about dataflows is that it’s saving the results to flat files in a data lake. Now, it was about this point that the DBA in me started freaking out. Why are we storing things in flat files? Flat file databases are older than I am!

(Sidenote: SQL Server 1.0 is about 6 months younger than I am.)

Well apparently, that’s standard fare for data lakes and how they scale. But the part that excites me is all the avenues that opens up. Because you can Bring Your Own Storage Account and gain access to all of that delicious data.

This is some seriously cool stuff.

Summary

Power BI remains a poor replacement for SSRS. But it’s a fine compliment to SSRS and is a growing way to report on the data living in you SQL Server.

For business users, especially Dynamics 365 users, it represents a way to get at and visualize their data. Power BI, PowerApps and Flow represent a huge step forward for business users, especially those stuck living in spreadsheets and access databases.

Finally, Microsoft wants to Power BI and the Common Data Service to be a central hub for all of your business data and analytics. This is going to expand into providing easy ways to take your business data and pipe it into Azure Machine Learning or Azure Databricks.

New Course: Deploying and Publishing Power BI Reports

My third Pluralsight course is out now, and it covers all the myriad ways of deploying Power BI:

  1. Manual sharing
  2. App workspaces
  3. Content packs
  4. Publish to web
  5. Office 365 embedding
  6. Power BI Premium
  7. Power BI Embedded

It can be overwhelming all the different ways of deploying Power BI, but in this course I walk you through the smallest, self-service options all the way to the large, scalable options.

image

I recently quit my job so that I could make more courses, so if you like what I do, please go watch it. You are supporting my family by doing so!

#SQLChefs: Power BI Datasets, Reports and Dashboards

This week we’ve got another episode of SQLChefs with Bert Wagner, where we talk about the different between datasets, reports and dashboards in Power BI.

What are datasets?

A Power BI Dataset is a series of Power Query queries that have been shaped in a DAX model. Each dataset can combine different files, database tables and online services all into one tabular model.  In our cookie analogy, these are all different “ingredients”.

Unlike SSRS, a dataset in Power BI does not represent a single table or query of data. A dataset should be considered more like a “flavor” of data used to accomplish a specific type of reporting: financial, operational, HR, etc. So in our analogy, the dataset is the “raw dough”.

So in Power Query, you are going to have a set of queries which each combine a data source with a usually linear set of transformations.

image

Then, in DAX, you are going to take each of those outputs and combine them into a model. This consists of defining relationships between the outputted tables and adding business logic via calculated columns and measures.

image

For more on the difference between Power Query and DAX, see our previous episode of SQLChefs.

What are reports?

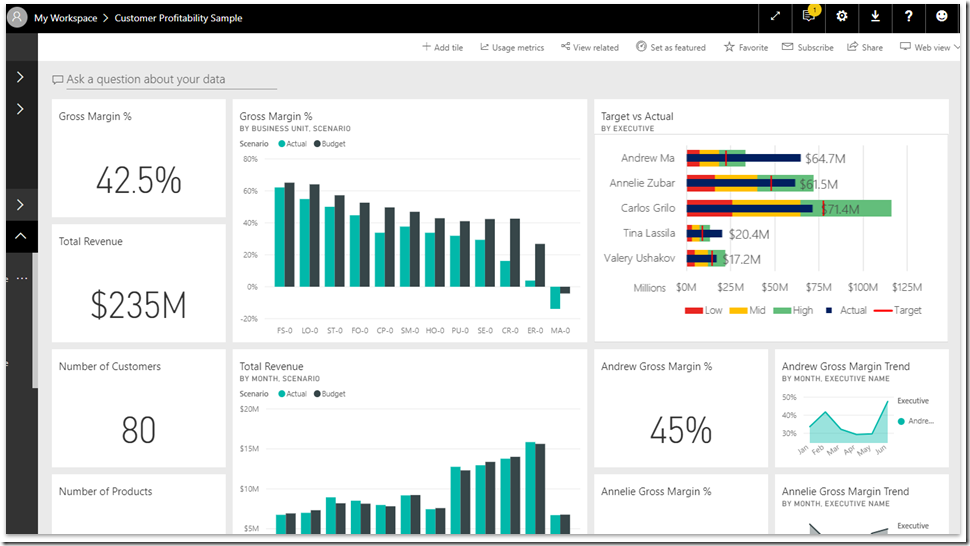
A power BI report is a series of visualizations, filters and static elements on a canvas. Power BI reports are saved as a single PBIX file and connect to a single dataset. Remember, a Power BI dataset can have many data sources.

image

(Demo file courtesy of Microsoft, MIT License)

Each report can have multiple sheets, just like an Excel workbook. In our analogy, this is us placing our “cookies” on multiple “cookie sheets” making one big batch, all of the same “flavor”.

One report per dataset

A quick aside to something that used to confuse me. In most cases, a report and a dataset are going to have a one to one relationship. A dataset can have one report and a report can have one data set.

Recently this has changed, however. A while back, they added the ability to use an existing dataset as a data source for a report. and at Ignite they announced the ability to share datasets outside of the app workspace they were made in.

That being said, while you are still learning Power BI, it’s easier to remember that in many cases, your dataset and your report are going to have a one-to-one relationship and be tightly linked.

What are dashboards?

In Power BI, dashboards are a way of pulling together visualizations from various reports. When you think dashboard, you are probably thinking something like Microsoft’s definition: “A Power BI dashboard is a single page, often called a canvas, that uses visualizations to tell a story. Because it is limited to one page, a well-designed dashboard contains only the most-important elements of that story.”

However, if you look at the report example above, it probably fits that definition. It is not a Power BI Dashboard. In Power BI, a dashboard is tool for pinning visuals from different reports and other sources of data.

image

In my opinion, a Power BI Dashboard is as much a tool for organization and navigation, as it is for actual reporting. I think that’s the real value add with Power BI dashboards.

Power BI Error: R cannot be added to gateway

If you are using R as a data source, you may want to be able to refresh the data or run that R script on a schedule. However, if you try to configure a On-premises Data Gateway to refresh the data source, you will see this error.

Extension{"extensionDataSourceKind":"R","extensionDataSourcePath":"R"} Cannot be added to gateway

tempsnip

Back in August 2016, Microsoft added support for refreshing R scripts but only  for the personal data gateway. So, in order to schedule a refresh where you are using R, you need to install and configure an on-premises data gateway in personal mode. The Microsoft documentation for r query steps reflects this limitation as well.

M vs DAX: Chopping Broccoli vs Planning a Menu

Last week, I had the pleasure of recording some video with Bert Wagner about Power BI. In the video, I got to use one of my favorite analogies for M versus DAX: Are you chopping broccoli or planning a menu?

One of the challenges with learning Power BI, is that you have to learn not 1, but 2 new data manipulations languages. And it’s not always clear what they are good for, especially if you come from the SQL world.

Is M a general purpose knife, or one of those weird egg slicers?

Head Chefs versus Sous Chefs

I have never worked in the restaurant business, but I’m going to make some gross generalizations anyway.

Sous chefs, as far as I can tell, do a lot of the prep work. They are cutting vegetables, cleaning food, making sauces, etc. While this is all important work, much of it doesn’t inform the final outcome. If you are making beef teriyaki or if you are making broccoli salad,  you still need to chop the broccoli.

The head chef however, gets paid for her brains just as much as her hands. The head chef is figuring out the menu and how to combine all of the ingredients. She is involved very heavily with what the final result is going to be. A head chef has to think of the broader goals and strategy of the restaurant, not just how to get the immediate task done.

M is the Sous Chef; DAX is the Head Chef

Again this is all a gross generalization, but in the restaurant called Casa De Meidinger this is actually the case! I do a lot of the grunt work when we cook a meal. My wife says, “zest this lemon” and I mindlessly do it. I could probably be replaced with a robot some day, and that would be fine by me.

Annie, however, actually enjoys planning a meal, deciding what to cook, and thinking about how to make the final product. To me, cooking is just a necessary evil for eating. I don’t necessarily get any joy from the process itself.

Working with M

I like to think of M as this sous chef. It does all the grunt work that we’l like to automate. Let’s say that my boss asks for a utilization report for all of the technicians. What steps am I doing to do in M?

  1. Extract the data from the line of business system
  2. Remove extraneous columns
  3. Rename columns
  4. Enrich the services table with a Billable / NonBillable column
  5. Generate a date table

This is all important work, but I would have to do the same work for a variety of reports. Many of the steps tell me nothing about the final product. I would generate a date table for most of my reports, for example.

Working with DAX

Now, if I’m working DAX, what am I going to do?

  1. Ask what the heck “utilization” really means

This was a real-life example that happened to me. What is utilization as a key metric? Well it turns out it depends what you are trying to report on. A simple definition is usage divided by availability. If a technician billed 20 hours and clocked in 40, his utilization would be 50%. Or so you would think.

How do we handle internal projects? Let’s say we have a technician who billed 2 hours to a customer, but spent 38 hours on an internal database migrations. What was his utilization?Well, if we are looking for billable utilization, it’s 5%. If we are looking for total utilization, it is 100%. These are questions that you are going to encapsulate in your DAX formulas.

The whole idea of a BI semantic layer is to hide away the meaning from the end users. When someone orders a cobb salad, they don’t want to have to articulate the ingredient list. They just want a darn salad.

Are you paid for your hands or your brain?

In the SQL Data Partners podcast, episode 114, there was a question: what’s the difference between a contractor and a consultant. One of the answers was this: a contractor is a set of hands, and a consultant is a set of brains.

I think this answer relates to M versus DAX. M is an automated set of hands, able to do work you’d normally do by hand in Excel. DAX let’s you take your domain knowledge and encode it into a data model. It’s an externalized representation for your brain.

And if you think about it, which do you want to be paid for? Do you want to get paid to unpivot data by hand every week? Or do you want to get paid for thinking, for understanding the business and for working at a higher level.

M allows you to automate the first step, so you can do more of the latter with DAX.

Are local credentials or passwords stored in the Power BI Desktop file?

When I presented on Power BI at Cleveland, I wrote up a blog post with all the questions I didn’t have an immediate answer to. I presented last week at Cincinatti and wanted to do the same thing.

This time there were some more difficult questions so I’m going to have to split it up into multiple blog posts.

Are local credentials stored in the Power BI Desktop file?

With SSIS, you have to be careful to export the SSIS files without any sensitive information included. But what about Power BI? If you save the .PBIX files on OneDrive, can you be exposing yourself to a security risk?

Looking at things, it looks like credentials for data sources are stored globally, so one wouldn’t expect them to be in the .pbix files.

image

So, first I turned the PBIX file into a zip file and poked around. I didn’t see anything suspicious.

Next, I ran image

If we open user.zip we find a folder called Credentials, with a single encrypted file inside. I’m willing to bet this is where the passwords are being stored.

image

image

Come see me present!

If you are interested in attending a future precon, I’ll be presenting at the following locations for 2018:

  1. Rochester, March 23rd
  2. Philadelphia, April 20th
  3. Wheeling, April 27th

Deploying Power BI: Scaling from 5 to 5000

Today, I had the honor of speaking at the here are the slides.

I want to be clear that this talk isn’t so much about scalability in the performance sense, but more in the IT Governance sense.

Why deployment can be a challenge

Deployments are pretty boring, just like most administration. You just hit publish, right? Figuring out the right solution for you is actually pretty difficult. So why is that?

Too many options

There are at least 9 different ways that you can deploy your Power BI reports:

  1. Sharing Dashboards / Reports
  2. Sharing Workspaces
  3. Organizational content Packs
  4. “Apps”
  5. SharePoint Embedding
  6. Power BI Premium
  7. Publish to Web
  8. Power BI Report Server
  9. Power BI Embedded

So you have all of these different options to choose from and at time it can be confusing. Which method makes sense for your organization?

It keeps changing

Even worse, Power BI is rapidly being iterated on. This is great for users, but a challenge for people trying to keep up with the technology. One year ago the following deployment options modes didn’t exist.

  1. Sharing individual reports (Jan 2018)
  2. “Apps” (May 2017)
  3. SharePoint Embedding (Feb 2017)
  4. Power BI Premium (May 2017)
  5. Power BI Report Server (June 2017)
  6. Power BI Embedded V2 (May 2017)

It can be a real challenge to keep up. I think that a lot of the dust has settled when it comes to deployment options. I don’t see them adding a lot of new methods. But I expect there to be many small tweaks as time goes on. In fact I had to make two changes to my slides this morning because they announced changes yesterday!

Organizing by scale

So, how can we get our arms around all of these different options. How can we organize it mentally?

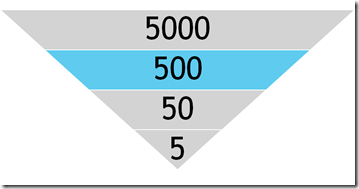
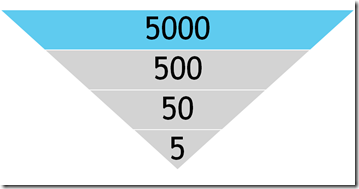
One way of approaching this is who do you want to share with? Do you need to reach 5 users, 50 users, 500 users, or 5000 users?

image

This is the framework that I use in the presentation and the rest of the blog post.

Before we jump into the different ways to deploy your reports, we need to talk briefly about the dirty little secret of self-service BI:

Self-service is code for “undermining IT authority”

Any time you make it easier for Chris in accounting to create and share reports without having to talk to Susan in IT, you chip away bit-by-bit at IT authority This isn’t always a bad thing. Sometimes the process governing your IT strategy is a bureaucracy.

image

The reason I bring it up is that you’ll find that the more users we need to reach, the more of a centralized structure we need to support it. Dashboard sharing is great for 5 users but is horrific for 5000 users. It’s just like building a tower or skyscraper. The requirements for a 10 foot building are drastically different than a 100 foot building.

Sharing with your Team

image

So let’s say you want to share with your team, just a handful of people. Well the good news is it’s pretty easy. You hit publish and you click share.

First you have to publish

Whenever you make a report in Power BI Desktop you have to hit the Publish button to push it out to the Power BI Service, a.k.a PowerBI.com.

image

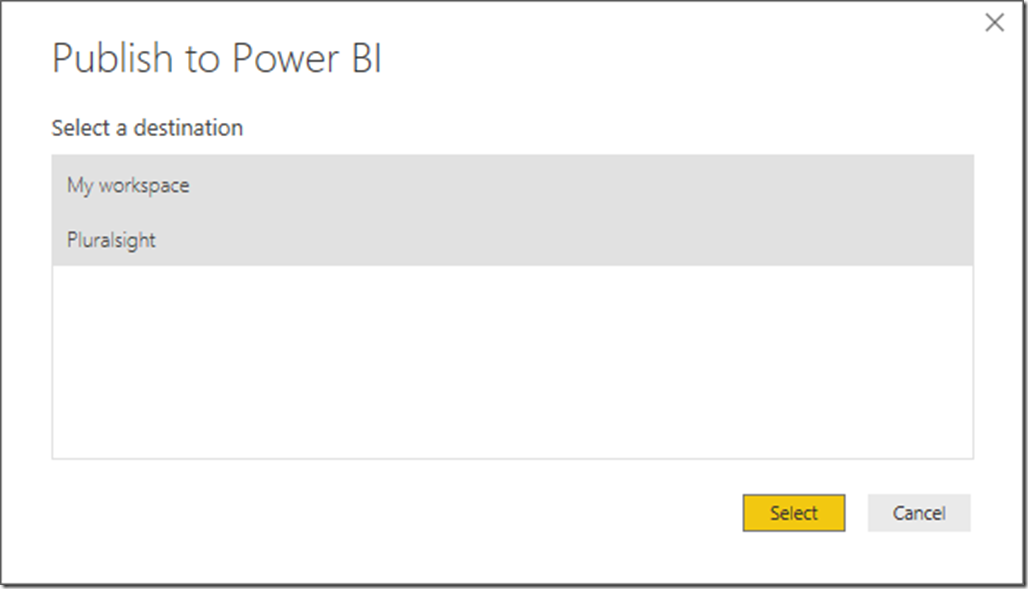
Whenever you do that, you are going to be asked what workspace you want to push it to.

image

A workspace is basically a container for all of your report artifacts: dashboards, reports and data sets.

Dashboard sharing

The quickest and easiest way to deploy reports is direct sharing. Once you’ve published a report, you can create a dashboard by pinning visualizations to it.

image

One it’s created, then you can hit the share button:

image

From that point you will be asked who you want to add. When you add users to a dashboard you can either given them read-only permissions or the ability to read and share.

Report sharing

Last month, they added the ability to share individual reports as well. The overall process is the same. Upload the report, hit share. The difference is now we can finally do that without creating a dashboard.

Workspace Sharing

So let’s say that you actually want to collaborate with other people on reports, or at the very least keep them all organized in a central location. The quickest and easiest way to do that is to share the whole workspace.

When you share a workspace you can make people either admins or members. You can also decide if you want those members to be read only, or able to edit the contents of that workspace.

This is ideal for collaboration or sharing with small groups. But if you have to support 100 users, it can start to break down, especially if all the members have edit privileges. Let’s take a look at the next level of scale.

Sharing with Power BI Users

image

Okay, you’ve been able to share with a handful of users. But now, you need to deploy “production” reports. This means having some sort of QA processes and a way to centrally manage things. We need to step up our game.

Organizational content packs

Organizational content packs were the original way of wrapping Power BI content in a nice bow and sharing it with the whole organization. Unfortunately they are now deprecated and have been mostly replaced by apps. Mostly.

The one use case for content packs is for user customizations. Whenever you share an app, the user gets the latest version of that app. With content packs, a user can download the pack and make personalization’s to their copy.

Business Intelligist has a good post breaking down some of the differences.

Power BI Apps

Power BI Apps are the definitive way to share content within your organization. A Power BI app is essentially a shared workspace with a publish button and some nice wrapping around it.

Apps provide a number of benefits:

  • QA and staging. Review your reports before deploying.
  • Selective staging. Work on reports without having to publish them.
  • Professional wrapping. Add a logo, description and landing page to your content.
  • Canonical Versioning. By using vehicles like Apps, you can have company endorsed reports.

To Share an App, you hit publish and are given a URL to distribute. Users can also search for your app. In the future, you will be able to push content out to your users directly.

Sharing with your whole organization

image

So let’s say that you want to expand your reach and share reports with everyone in the entire organization. In that case you will either need to a) change your licensing approach, b)move away from powerbi.com, or c) both.

Power BI Premium

Power BI Premium is ideal if you have lots of users and lots of money. With Premium, instead of licensing users you license capacity. You are essentially paying for the VMs behind power bi service instead of the individual users viewing the content.

Power BI Premium is a licensing strategy, not a deployment strategy. The deployment is secondary.

Remember what I said about lots of money? The full Power BI Premium SKUs start at $5000 per month. If you are paying $10 per user per month, the break-even starts around 500 users. That’s a lot of users.

From a user experience perspective standpoint, absolutely nothing changes with changes. you mark a workspace as premium, and now it’s isolated and free to users.

image

Image source: Microsoft

Power BI Premium also offers scalability benefits. Larger data sets, better performance, more frequent refreshes. If you are bumping up against the limits of the Power BI Service, Power BI Premium might make sense for you. The whitepaper goes into much more detail.

SharePoint Online Embedding

If your organization has made heavy investments in SharePoint, it may make sense to use SharePoint as the front-end instead of powerbi.com

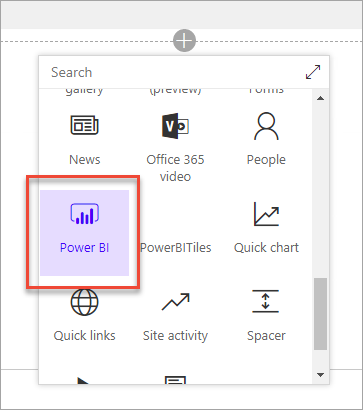
To deploy a report to SharePoint Online, crate a new page and then add the Power BI Web Part.

Image Source: Microsoft

Once you add the web part, you have to specify the URL of your report and you are done.

From a licensing perspective, users with need to have Power BI Pro, or you can use the EM SKUs of Power BI Premium. The EM levels with cost you $625-$2495 per month.

Power BI Report Server

EDIT: This section is incorrect and will be updated. Please see David’s comment at the bottom.

For a long time, the #1 requested feature was Power BI on-premises. Power BI Report Server is basically SSRS with support for rendering Power BI reports. The deployment story is very similar to SSRS reports. Users would go to the web portal and open up reports from there.

Unless you have data sovereignty regulations or highly confidential data, you shouldn’t use Power BI Report Server. The first reason is that it is very expensive. There are two ways to get Power BI Report Server:

  • Licensing is included with Power BI Premium
  • SQL Server Enterprise Edition + Software Assurance

The other issue is that Power BI Report Server is that it is still limited:

  • No support for Dashboards
  • No support for Scheduled Refresh
  • No Q/A or Cortana support

I expect that they are going to continue to improve upon PBI Report Server, but as with an on-prem solution, it’s always going to be lagging behind the SaaS model.

Sharing with everyone

image

So let’s say that you want to go a little bit broader, what if you want to share with people outside of your organization. What if you want to share with everyone?

Publish to Web

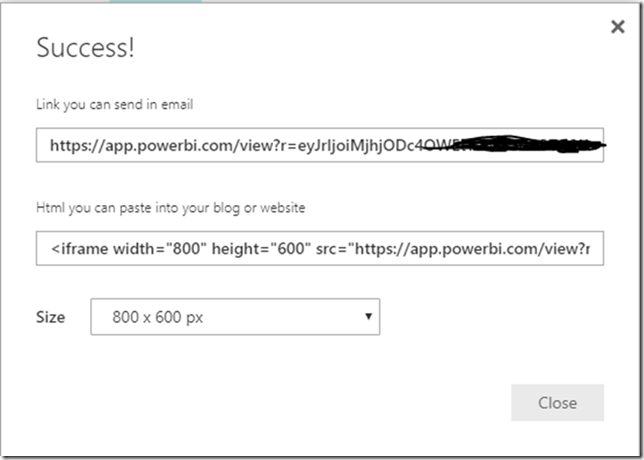
The simplest and easiest way to share with people is to use Publish to Web.  When you publish a report you will be given a public URL and an iframe for embedding.

image

If you use publish to web, it’s completely free to anyone to view. However, your data is publicly available. Anyone with access to the URL can view the underlying data. If this sounds bad, be aware that you can disable publish to web at the tenant level or for specific security groups.

Power BI Embedded

To use Power BI Embedded, you are going to need a web developer. There are no two ways about it. And web developers are expeeeensive.

image

Power BI Embedded allows you to use Javascript to control and embed Power BI reports in your web application. One of the consequences of using Power BI Embedded id you are going to have to roll your own security. You aren’t going to be giving users access like normal.

The other thing to know about Power BI embedded is that it depends on Power BI Premium to back it. So you are paying for capacity, not users. In this case you are using the A SKUs, which cost $725-$23,000 per month. That will get you 300-9600 render per hour.

If you want to start playing around with it, there are samples available.

External Sharing

While this isn’t a way to share with thousands of external users, it bears mentioning that you can share with external users. This is ideal if you have a handful of external clients. The overall user experience is largely the same. The big difference is that their account can live in a different Azure Active Directory tenant.

I won’t go into detail about it here, but check this link out if you want to learn more. There is also a whitepaper (AAD B2B) that goes into even more detail.

What now?

If you head isn’t spinning from all the information, definitely check out the deployment whitepaper. Chris Webb and Melissa Coates go into excruciating detail into all of your options and all the different details to consider.

Power BI Precon Wrap-up, Cleveland 2018

This weekend, I had the honor of presenting my Power BI precon for SQL Saturday Cleveland. I’ll be giving the same presentation March 16th in Cincinnati.

Inevitably, there are always some questions that I don’t have an answer for.  What I like to do is circle back and try to get some answers for the people who attended.

Do clustered data gateways provide load balancing?

Back in image

That being said, I created a view in the main database pointing to a different database and there wasn’t any issue. Going further, I decided to test out picking on database and hand typing a query pointing to a different database.

image

And it works! It’s very interesting, I wonder where the limitations comes from if it’s so easy to get around.

What’s the best way to connect to a Web API application?

One attendee said they use ASP.net Web API as middleware for a large number of databases and tables. So what is the best way to connect to Web API for Power BI?

Steve Howard has a great blog post about different options. Probably the best option is to add OData support to your Web API.

If the API is complex and OData is not an option, custom data connectors are worth looking into. You’ll be writing a lot of M code, but it can be a good way to encapsulate that complexity.

Does Power BI support SAP Universe?

So the situation for SAP Universe is a bit weird. Back in 2014 they added support for SAP Business Objects.

But then later they removed it because of licensing concerns? It’s not entirely clear to me. That being said, there is a request for support to be added back.

Digging a bit deeper, it sounds like there might be a workaround using the SAP OData API, but that’s not the ideal solution.

What are the best options for sharing reports with external customers?

A question I here a lot is how do you share with customers and deal with multi-tenant databases.

Well very recently, back in November 2017, Power BI added support for external users with Azure B2B. This includes support for row-level security, which means you can have all your data in a central database and limit a customer to just their own data. This is very exciting.

There is a whitepaper if you want to learn more.