
Category: Career & Professional Development

  • Practicing Statistics: Female DBAs and Salary

    |

    Brent Ozar recently ran a salary survey for people working with databases, and posted an article: Female DBAs Make Less Money. Why?

    Many of the responses were along the lines of “Well, duh.” I, personally,  felt much of the same thing.

    But, I think with something like this, there is a risk for confirmation bias. If you already believed that women were underpaid, there is a chance that you’ll see this as more proof and move on, without ever questioning the quality of the data.

    What I want to do is try to take a shot at answering the question: How strong is this evidence? Does this move the conversation forward, or is it junk data?

    Consider this blog post an introduction into some statistics and working with data in general. I want to walk you through some of the analysis you can do once you start learning a little bit of statistics. This post is going to talk a lot more about how we get to an answer instead of what the answer is.

    Data Integrity

    So, first we want to ask: Is the data any good? Does it fit the model we would expect? Barring any other information I would expect it to look similar to a normal distribution. A lot of people around the center, with roughly even tails on either side, clustered reasonably closely.

    So if we just take a histogram of the raw data, what do we get?

    image

    So, we’ve got a bit of a problem here. The bulk of the data does look like a normal distribution, or something close to it. But we’ve got some suspicious outliers. First we have some people allegedly making over a million dollars in salary. That’s why the histogram is so wide. Hold on, let me zoom in.

    image

    Even ignoring the millionaires, we have a number of people reporting over half a million dollars per year in salary.

    image

    We’ve also got issues on the other end of the spectrum. Apparently there is someone in Canada who is working as an unpaid intern:

    image

    Is this really an issue?

    Goofy outliers are an issue, but the larger the dataset the smaller the issue. If Bill Gates walks into a bar, the average wealth in the bar goes up by a billion. If he walks into a football stadium, everyone gets a million dollar raise.

    One way of looking at the issue is to compare the median to the mean. The median is the salary smack dab in the middle, whereas mean is what we normally think of when we think of average.

    The median doesn’t care where Bill Gates is, but the mean is sensitive to outliers. If we compare the two, that should give us an idea if we have too much skew in either direction.

    image

    So, if we take all of the raw data we get a $4,000 difference. That feels significant, but could just be the way is naturally skewed. Maybe all the entry level jobs are around the same, but the size of pay raises get bigger and bigger at the top end.

    Averages after removing outliers

    Okay, well lets take those outliers out. We are going to use $15,000-$165,000 as a valid range for salaries. Later on I’ll explain where I got that range.

    There are 143 entries outside of that range, or about 5% of the total entries. I feel comfortable excluding that amount. So what’s the difference now?

    image

    So the middle hasn’t moved, but the mean is about the same now. So this tells me that salaries are evenly distributed for the most part, with some really big entries towards the high end. Still, the $4,000 shift isn’t too big, right?

    Wait, this actually is an issue…

    Remember when I said 2 seconds ago that $4,000 was a significant but not crazy large? Well, unfortunately the skew in the data set really screws up some analysis we want to do. Specifically, our friend Standard Deviation. We need a reasonable standard deviation to do a standard error analysis, which we cover later.

    Standard Deviation is a measure of the spread of a distribution. Are the numbers clumped near the mean, or are they spread far out? The larger the standard deviation, the more variation of entries.

    If a distribution is a roughly normal distribution, we can predict how many results will fall within a certain range: 68% within +/- 1 standard deviation, 95% within +/- 2 deviations, 99.7% within 3 deviations.

    Well, because of the way standard deviation is calculated, it is especially sensitive to outliers. In this case, it’s extremely sensitive. The standard deviation of all the raw data is $66,500 . When I remove results outside of $15-$165K, the standard deviation plummets to $32,000. This suggests that there is a lot of variability in the data being caused by 5% of the entries.

    So let’s talk about how to remove outliers.

    Removing Outliers

    Identifying the IQR

    Remember when I got that $15,000-$165000 range? That’s by using a tool called InterQuartile Range or IQR.

    It sounds fancy, but it is incredibly simple. Interquartile range is basically the distance between the middle of the bottom half and the middle of the top half.

    So in our case, if we take the bottom half of the data, the median salary is $65,000. If we take the top half of the data, the median salary is $115,000. The IQR is the difference between the two numbers, which is $50,000.

    Using IQR to filter out outliers

    Okay, so we have a spread $50,000 between the first and third quartiles. How do we use that information? Well there is a common rule of thumb that anything outside +/- 1.5 IQR is an outlier. In fact, when you see a boxplot, that is what is going on when you see those dots.

    So, $50,000 *1.5 is $75,000. If we take the median ($90,000) and add/subtract 75,000 we get our earlier range of $15,000-$165,000

    Standard Error Analysis

    Okay, so why did we go through all that work to get the standard deviation to be a little more reasonable? Well, I want to do something called a Standard Error Analysis to answer the following question:

    What if our sample is a poor sample?

    What is our average female salary is lower because of a sampling error? Specifically, what are the odds that we samples a lower average salary by pure chance? “Poppycock!”, you might say. Well, standard error gives us an idea of how unlikely that is.

    Importance of sample size

    Let’s say there are only 1,000 female DBAs in the whole world, and we select 10 of them. What are the chances that the average salary of those 10 is representative of the original 1,000? It’s not great. We could easily pick 10 individuals from the bottom quartile, for example.

    What if we sampled 100 instead of 1000? The chances get a lot better. We are far more likely to include individuals that are above average for the population as a whole. The larger the sample, the closer the sample mean will match the mean of the original population.

    The larger the sample size, the smaller the standard error.

    Importance of spread

    Remember before we said that a reasonable standard deviation is important?  Let’s talk about why. Let’s say there are 10 people in that bar, and that the spread of salaries is small. Everyone there make roughly the same amount. As a result the standard deviation, a measure of spread, is going to be quite small.

    So, let’s say you take three people at random out of that bar, bribe them with a free drink, and take the average of their salaries. If you do that multiple times, in general that number is going to be close to the true average of the whole population (the bar).

    Now, Bill Gates walks in again and we repeat the exercise three times. Because he is such an outlier, the standard deviation is much larger. This throws everything out of whack. We get three samples: $50,000, $60,000, and $30,000,000,000. Whoops.

    The smaller the standard deviation of a population, the smaller the standard error.

    Calculating Standard Error

    Getting the prerequisites

    To calculate the standard error, we need mean, standard deviation and sample size. Before we calculate those numbers, I want to narrow the focus a bit.

    I’ve taken the source data, and narrowed it down to US, DBA and within $15,000-$16,5000. This should give us more of an apples to apples comparison. So what do we get?

    image

    We’ve got a gap in average salary of about $4,500.  This seems quite significant, but soon we’ll prove how significant.

    We’ve also a standard deviation of around $24,500. If salaries full under a normal distribution, this means that 95% of DBA salaries in the US should be within $52,500-$151,000. That sounds about right to me.

    Calculating individual standard error

    So now we have everything we need to calculate standard error for the female and male samples individually. The formula for standard error is standard deviation divided by the square root of the count.

    So for females, it’s 23,493 / sqrt(123) = 2118. This means that if we were only sampling female DBAs, we would expect the average salary to be within +/- $2,118  about two thirds of the time.

    image

    So, if we were to randomly sample female DBA’s, then 95% of the time, that sample’s average would be less than the male average from before.

    image

    That seems like a strong indicator that the lower average salary for females isn’t just chance. But we actually have a stronger way to do this comparison.

    Standard error of sample means

    Whenever you want to compare the means from two different samples, you use a slightly different formula which combines everything together.

    The formula is SQRT( (Sa^2 + Sb^2) / (na +nb)) . S is the standard deviation for samples a and b. Standard deviation squared is also known as the variance. N is the count for samples a and b.

    If we combine it all together we get this:

    image

    The standard error when we combine samples is $1,154. This indicates that if there was no difference between the distribution in female and male salaries, then 68% of the time they would be within $1,154.

    Well in this case, the difference in means is almost 4 times that. So if the difference in means is 3.88 standard deviations apart, how often would that happen by pure chance? Well, we would see this level of separation 0.01% of the time, or about 1 in 10,000.

    Conclusion

    I take this as strong evidence that there is a real wage gap between female and male DBAs in the USA.

    What this does not tells us is why. There are a number of reasons that people speculate as to the cause of this gap, many in Brent’s original blog post and the comments below it. I’ll leave that to them to speculate what the cause is.
  • Code for my PASS Summit Presentation 2017

    A couple of people were asking for the code to my demos, so here it is! I’m utterly exhausted, but it was such an honor presenting to so many people. My favorite part was getting to thank a hard-of-hearing gentleman in sign language for asking a question at the very end.

    Eugene Meidinger – Execution Plans 101_11-01-2017

  • How to write a good abstract for GroupBy.org

    Recently, I’ve been going through a lot of the presentations for GroupBy.org. I’m trying to provide as much feedback as I can, because I think good feedback is hard work. A lot of the existing comments are along the lines of “This looks cool!”, which does not provide much direction. As a presenter myself, I’m a big fan of receiving actionable criticism. It’s the only way I will grow as a presenter.

    This post is going to cover some general guidance for making a fantastic abstract. It’s targeted at the GroupBy.org site, but much of the advice is broadly applicable

    You should write like you fight

    When you edit your abstract, you should be relentless, you should be merciless. Every sentence should dance. Every sentence should sing. Every word owes you rent, and you are here to collect. You, my friend, have neither time nor patience for any freeloaders. If anything does not enhance your message, ditch it. This ain’t a charity, kids.

    You should write like your life is on the line.

    You should write like you fight. This is not a joke. This is not hyperbole. Because someday, your life, your ability to provide for your family, will depend on your ability to communicate clearly. Someday one of these things will happen to you:

    1. Your company will get bought, and you will have to explain “what do you do around here?”
    2. You will be out of a job and need to write an amazing cover letter
    3. You will need to summarize what you’ve done this year and why you deserve that raise
    4. Something will go horribly wrong at work, and it will be your job to write the retrospective
    5. Your coworker will cross a line, and you will need to stand up for yourself in a polite, professional way.

    Are you ready for that day? If you are writing half-hearted abstracts today, you are probably half-hearted emails and cover letters. If you aren’t writing like your life it on the line today, then you aren’t preparing for when it actually is. We practice when the stakes are low, so we are ready for the day that they aren’t.

    What martial arts teaches us about good writing

    I do martial arts every week. Not because I’m a particularly aggressive or athletic person. I do it because it helped me lose weight and because it keeps me healthy. I lost 70lbs in large part to martial arts, so I think I owe it some respect and deference. In a very real sense, it has changed my life forever.

    In my school, everything we do is preparing us for a fight that hopefully never happens. The goal isn’t to get into these scenarios, but to be prepared should the worst ever happens. Learning how to give a solid punch doesn’t make me cocky and reckless, it makes me humble and cautious. This is because I know how quickly a fight can fall apart; I know how much a punch to the face hurts.

    In martial arts, specifically, we practice moves hundreds and thousands of times. We refine and we focus until it’s reflex. Because trust me, when you are scared and under pressure, all of your form goes to crap. When I participated in my only tournament, I got hit really hard on the chin. Hard enough that my ears were ringing and they had to check if I was okay. It was because I was scared. It was because under pressure, I forgot all of my form. It was because good form wasn’t reflexive for me.

    Good form should be reflexive

    We practice things over and over, when the stakes are low, so we don’t have to think when the stakes are deadly. I can’t say this enough times. This is how lives are saved.

    When you write an abstract, you are practicing for when it really matters. In martial arts, if you don’t practice keeping your fists up when there is no danger, you’ll get sucker punched when there is. Trust me, I know from experience.

    Good form comes from intentional, relentless practice. Edit, edit, edit. Please, for your own sake.

    How to write a great abstract

    So what makes a good abstract? What makes good form? I think there are a number of fundamental things that people regularly miss.

    Dear presenter, why do I care?

    Your first sentence should tell me why I care. Why do I want to attend your presentation? Don’t assume that just because you think it’s important that I agree with you. You have to persuade me. You have to explicitly communicate how it benefits me.

    Your whole abstract should hang on this premise. If a sentence does not in some way help answer this question, cut it. If it isn’t abundantly clear, rework it.

    So how do I communicate this? There are a number of ways:

    • Give them a headache. Tell them what problems they have.
    • Give them a solution. Tell them how this talk will solve those problems.
    • Tell them how they will grow. People want an immediate payoff. Explain how they will be better for watching your presentation.
    • Don’t assume it’s important. Show me why your topic is important.

    If you can answer why people should care, you will be a step ahead.

    Figure out your audience. Narrow it.

    Who is your audience? Who cares about your topic?

    Did you figure it out? Great, now narrow it. Audience statements are often too broad to begin with. Ask yourself, “Who would be really excited to watch your presentation?”. Make them your target audience. Don’t feel that you have to cater to everyone.

    Curiosity is almost a terrible audience goal. Find people who have a need and fill it.

    Additionally, who isn’t your audience? There should be people who you don’t want to attend your presentation. This concept is often more helpful than knowing your target audience. Don’t be afraid to exclude people. A broader target leads to a muddled message.

    In the agile world, there is idea of personas. Use them. Let’s say that Susan is a fictional person who really wants to watch your presentation.

    1. Who is she?
    2. Why is she super pumped about your presentation?
    3. How do you communicate this to her, efficiently?
    4. What things does she already know? What new things is she going to learn?
    5. Who isn’t she?

    If you can paint a vivid picture of this person, your abstract will be better for it. Even better, your presentation will improve too.

    Get your level right

    Relating to the item above, figure out what level your presentation is. Is it for total newbs? Then make sure you have a lot of introductory content. Be very clear about what you are assuming they already know. Write it out on a piece of paper. Don’t assume. Don’t assume.

    Is this more of a 300-level practical presentation? Well then “curiosity” had better be nowhere in your target audience. Make sure you elaborate the detailed content that you will cover. Make it clear that they will take something practical away from this.

    I’ve seen a number of abstracts that try to split the difference and just muddy the waters. Pick an audience and stick with it. Decisions aren’t decisions until you give something up. You have to make a choice. Who are you targeting? Be clear about this and your viewers will thank you for it.

    Put the bottom line up front

    Get to the point right away. Explain your general thesis in the first couple of sentences. Explain why the reader cares in the first few sentences. You can include all the detail later on. This is a matter of being respectful to your reader, who is a busy person. Don’t waste their time.

    In journalism, this is called inverted pyramid style. The professionals use this method. You should too.

    To summarize, If you can’t sell me in a tweet, you’ve lost me as a reader. Keep it tight. You can add the details later.

    Make your prose scannable

    People don’t read the internet like a book. People scan. They’ve done eyetracking studies where they literally watch people’s eye movement. Keep your prose tight and short. Use technical writing techniques.

    1. Keep your sentences short. Break up run-on sentences. Avoid sentences more than 15 words, like the plague.
    2. Use bullet lists, where possible. These are GREAT for scanning text.
    3. Use multiple paragraphs. You have the space, use multiple paragraphs for multiple purposes.
    4. Have a structure. I personally like the 3 paragraph structure of
      1. “Why do I care?”
      2. “What will we cover?”
      3. “What will I take away from this?”
    5. Use action verbs. Avoid is, was, became, etc.
    6. Use a little formatting. Unlike most events, you have full control of your formatting. Use it.

    If you can’t see the flow of your text from 10 feet away, reconsider how your have structured your text. Blobs don’t scan well.

    I got sucker-punched via email this week, but I was ready

    So at the beginning of this week, I got thrown under the bus. In large part, it was my own fault. I had, in fact, missed deadlines that delayed a colleague’s work. That part was true.

    The part that was the sucker punch was that he contradicted with an earlier conversation. When the author and I spoke, it sounded like his deliverables were being blocked by time constraints as well. I was late, but I offered to rush Friday morning so he could get his weekend part done on time. He indicated that there were other factors holding things up, that there was no point in rushing.

    So now I’m in a situation where I thought everything was fine, but instead my boss is getting a surprise email, Monday morning. An email indicating that the project is being delayed a week, solely because of me. One hour before the manager’s meeting. Ugh.

    So my boss sends me a one sentence email. “Did we know about this?”

    The advantage of being ready

    So now I have half an hour to lay out a timeline of events, and give my side of things. And because I practice my writing, I was able to write this:

    Even with a heavy blur and shrink you can see the structure. It’s got the bottom line up front. Everything you really need to know is in the first 4 sentences.

    Again, I want to be clear. It was my fault for missing deadlines. It was my fault for not communicating that to my boss. I’m not some victim here.

    But I did receive a surprise, and I was ready for it. Because I practice my form daily. And you should too. Write good abstracts. Write good emails. Practice, practice, practice.

    Keep your fists up folks, it’ll guard your chin. Otherwise it’ll hurt like hell, and your ears will be ringing. I know from personal experience.

     Summary

    Write your abstracts like your life depends on communicating clearly and efficiently. Determine a targeted audience and tell them why they should care. Keep it tight, keep it scannable. Edit, edit, edit. Practice, practice, practice.

    Good luck!

  • Things I like about the changes to PASS Summit submission process

    So, PASS Summit is making changes to how the curriculum is managed. There’s been some conversation about these changes and whether they are good are not. I thought I would enter the conversation and add my thoughts.

    Before that though, I want to thank the board for the work that they do and working on these changes. I think that being on the board is difficult work. It seems to me that no matter what changes they make, there will be criticism. Often, the criticism is the loudest of all the commentary. Sure, I agree there is more they could do to involve community feedback; however, the fact that they have a survey and community townhall is evidence that they are listening and value our opinion.

    So, I’m going to try to focus on the positives I see, instead of criticizing. Overall, I think these changes are a good move. I wrote last PASS that I think the data platform is broadening. And while I think that the idea of a data profession presents challenges, I think it’s reflective of trends going on:

    1. The devops-ification of the data platform
    2. A broadening of the surface area of  “data platform”
    3. Virtualization, Moore’s law and Cloud

    These are all forces that are causing more technologies to fall under a broader and broader grouping. They are also causing a blurring what used to be more distinct roles. And as a result, PASS Summit is responding to that change.

    Having a broader, more nuanced set of topics requires more control. If  you look at companies like Pluralsight or Lynda, they have people whose job is to manage a curriculum. And part of that job is aggressively targeting specific topics to avoid gaps.  It also means doing market analysis to see what education people want and need, not just what people want to present on. These goals makes sense for Summit too.

    Part of targeting specific topics, is acknowledging that there are top-level experts in those content areas. If you want something on DAX, reach out to Marco Russo. If you want something on U-SQL, reach out to Michael Rys. Dealing with the changes in the platform require a different approach. In some ways, it would be a shame to to not try to get access to the top leaders of specific topic areas.

    I admit that it’s reasonable to worry about Summit becoming some sort of elite club of presenters. Part of the solution is transparency, transparency, transparency. The other part of the solution is answering the question “How do I present at Summit?”

    There’s a joke about industries with no entry level jobs. How do those types of industries exist? How do they not just die out? But I don’t think entry level is the issue here. There are tons of opportunities to speak at user groups. SQL Saturdays are a clear stepping stone after that. The next step is…less clear. Do you blog? Do you speak at virtual user groups? Do you go to 20 SQL Saturdays a year?

    No seriously, I don’t know. Can someone tell me? You wanna know why I started presenting at virtual user groups? Because I asked someone how to get to Summit, and they suggested that as a stepping stone. I think it’s important to give “new” speakers like me a path for reaching the top.

    It’s straightforward to get your white belt in speaking, even your green belt. But it’s a lot less clear how to get your brown or black belt. That’s an area I’d love to see more people talk about. A good example is Brent Ozar’s Career Internals.

    That being said, I’m happy with the minimum bar of experience for applying. The current minimum is 3 presentations. I honestly think it could be 5 and it’d be fine. This is a good balance between requiring a base level, while not discouraging new speakers. Three is so low, you could trip over it. That’s two user groups and a SQL Saturday. I can promise you that when I had given only 3 presentations, I was in no way qualified to present to PASS.

    One final thing I’m really happy about is that they are going to give guidance on the content they want, and they are going to ask people to specify a general content area they are focusing. I think this is a smart move. The current system just wasn’t sustainable.

    The old system seemed to encourage just throwing as much stuff against the wall as you could and see if anything stuck. I don’t think we want to incentivize people submitting more than 3-4 sessions. It puts an undue burden on the people reviewing the submissions. I honestly think it’d be fine to have an explicit limit on submissions, but I expect that would make some waves.

    Overall, I think they are making moves in the right direction and I like it.

  • Slides for PASS BI Virtual Group

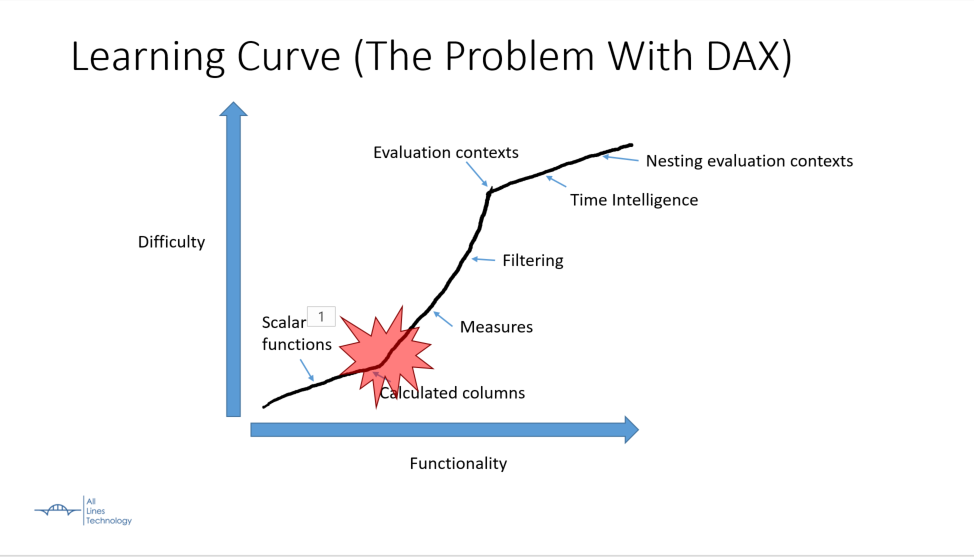
    Today I’m going to be presenting on DAX for the PASS BI Virtual Group. The focus is on all the hard mental concepts of DAX. If I could sum up the talk in one picture, it would be this:

    That red area is where I banged my head when learning DAX. The learning curve shoots up wildly in the middle of learning the technology, instead of a slow gentle curve. This presentation covers the middle parts that are key to understanding DAX.

    Here are the slides for the presentation: Introduction-to-DAX-2017-03-30

    Here is the recording:


    Here is the talk by Marco Russo I mentioned in my presentation: Optimizing Multi-Billion Row Tables in Tabular

  • Slides for Excel BI VC presentation

    Phew! That was nerve wracking and exciting. Here are the slides from my presentation, the excel file is at the end. I’ll update the blog post with more detail when I get a chance.

    EDIT: It looks like I didn’t properly attach the Excel to the PowerPoint. This has been fixed.

    Introduction to DAX – 2017-01-12

  • PASS Summit–Quick thoughts

    Last week I was at PASS Summit and it was an incredible time. I went in feeling deflated about my career and came out excited and energized. It was wonderful seeing the potential of the Microsoft Data Platform and where things are going. It was also great to meet a lot of people and hang out with my SQL Saturday friends.

    Overall, there was one theme I saw over and over again. You could call it technological diversity. You could call it fragmentation. You could call it accelerating growth. What it really comes down to is more technologies, more platforms and more things to learn.

    You could see it in the keynotes multiple times. SQL Server is now on Linux. Polybase connects to Mongo. NoSQL support is available via DocumentDB. PASS is rebranding and focusing on the Microsoft Data Platform, not just SQL Server. Clearly the surface area of a data professional is expanding.

    I like that term a lot, Data Professional. At first, it sounds meaningless and generic. But it’s one of the few things that aptly describes what I do. Because being able to be just a DBA or a database developer is going to get rarer. Now you need to know a bit about Azure. Now you need to know a bit about Excel and PowerPivot. Now you need know the difference between Pokemon and Big Data.

    All of this has inspired me to work on my first professional development session; Drinking From the Firehose: a Guide to Keeping Up With Technology. I’ve submitted it to SQL Saturday Cleveland. I also might get to present it for the Professional Development VC. I’m hoping if I can put some of these concepts into words, I can get a better handle on them myself.

  • Slides for SQL Saturday Columbus 2016

    Here are the slides for my talk on Power BI. I was really excited to take a different spin on this topic.

    PowerBI-2016-07-16

  • Slides for SQL Saturday Baltimore

    Here are my slides and code for SQL Saturday Baltimore 2016


    April 2016 – Beyond select Star