Power Query Is No Longer DAX’s Little Brother

I’ve talked before about the difference between the Power Query Formula language, or M, and the DAX language.

I would describe Power Query as the intern you pay minimum wage or the sous chef, and DAX as the $35 per hour analyst or the head chef. This wasn’t to be mean but instead was just because Power Query was all about automating repetitive data manipulations. It handled the less exciting, less complicated work.

Last week, however, I presented on Power Query, and I had to update the slide about where it’s available. I used to say that wherever DAX is, Power Query was not very far behind. Doing all of the grunt work so that DAX could shine. But this time I had to update my slides because Power Query is starting to take center stage.

Now instead of just being available in Excel, Power BI and SSAS, Power Query is available in Microsoft Flow, SSIS and ADF! At the time this post was published, these are all in preview. But it’s really exciting to see Power Query no longer trailing behind DAX, ready to take center stage.

T-SQL Tuesday #114 – An Unsolved SQL Puzzle

This week’s T-SQL Tuesday invitation is all about puzzles. I’ve got an accidental puzzle that I’ve never quite solved, from one of my demos. I’m sure the answer will be a “Well duh!” moment.

I give presentations on SQL Server execution plans. As part of that, I like to show that if you pull a single row from a heap, it has to read everything. As part of that demo, I try to push everything out of memory by disabling readahead reads, taking a checkpoint, and dropping clean buffers. But for some reason… it never quite works!

IF NOT EXISTS ( SELECT  *
FROM    sys.schemas
WHERE   name = N'Demo' )
EXEC('CREATE SCHEMA [Demo] AUTHORIZATION [dbo]');
GO

IF OBJECT_ID('Adventureworks2014.Demo.Person', 'U') IS NOT NULL
BEGIN
DROP TABLE AdventureWorks2014.Demo.Person;
END

SET STATISTICS IO ON

SELECT *
INTO [AdventureWorks2014].[Demo].[Person]
FROM [AdventureWorks2014].[Person].[Person]

DBCC TRACEON (652,-1);

CHECKPOINT
DBCC DROPCLEANBUFFERS

SELECT * FROM [AdventureWorks2014].[Demo].[Person]
WHERE BusinessEntityID = 25

You can see here that it shows 3,808 logical reads, but 5 physical reads.

Screen shot of statistics IO showing the number of reads.

I’m sure there is some simple way to force it to do all of the physical reads, but I have yet to figure it out. Or it may be that I’m misunderstanding something and physical reads are the only pages used. But when I look at the execution plan, it says it read all of the rows.

I’d love to get an answer to this puzzle. I’m sure it’s something simple.

Update: Andy G. asked if maybe the issue is I’m not using all the rows. Here I tried a heap of a single row, and I get 1 logical read and 0 physical reads.

Table 'Person'. Scan count 1, logical reads 1, physical reads 0, read-ahead reads 0, lob logical reads 0, lob physical reads 0, lob read-ahead reads 0.

Push Your Outlook Calendar to Google Calendar with Microsoft Flow

Sometimes you may want your Outlook Calendar events copied to Google Calendar. This can be done with a handful of clicks and Microsoft Flow. Additionally, this is completely free if you have Office 365.

EDIT: Based on some comments, I would like to clarify that this template only works for copying over your calendar events when they are initially created, i.e. inserts. It does not process updates or changes to your calendar events. You will likely have to look into paid software for this functionality. I’ve changed the title from “Sync” to “Push” to reflect this.

What is Microsoft Flow?

Microsoft flow is the third piece of the Microsoft Power Platform:

  1. Power BI – Interactive analytics.
  2. PowerApps – Low-code mobile and web applications.
  3. Flow – User-friendly event integrations.

The Power Platform is a set of tools aimed at business users that want capabilities that were originally limited to professional coders or BI developers.

Out of the three, Microsoft Flow is the weirdest because it’s so granular. The unit of measure for Power BI is the report, the unit of measure for PowerApps is the application, and the unit of measure for Microsoft Flow is the flow or event trigger. And event triggers are really, really tiny.

Essentially, a flow is a trigger and then a series of actions, much like you might map out with a flow chart. It functions similarly to IFTTT or Zapier. I think of it as the glue or connective tissue between different applications.

In this post, we are going to glue together our Outlook Calendar to our Google Calendar.

Why connect calendars?

Back when I worked a normal job, I had two calendars: Office 365 for work and Google for home. Now that I work for myself, that’s a lot more complicated. Sometimes a customer will create an account for me in their network. Sometimes I’ll partner with other consultants and work as part of their team. And of course, I’ve got my own work email at eugene@sqlgene.com.

I need all of these calendars to consolidate to one place. My natural inclination and personal preference is to put it all into Google. Now, there are sync apps available, but this sort of problem is a perfect use case. A calendar event is created in outlook, a flow is triggered, and that information is transferred to Google.

Using Flow

To use Flow, I simply went to https://flow.microsoft.com and searched for Google Calendar. The template search for Flow sorts by popularity, and unsurprisingly the top result was exactly what I wanted.

image

Once I selected the template, then I needed to log into my Google account.
image

Then I just needed to select the calendars from both accounts that I wanted to sync.
image

And that’s it! I was pleasantly surprised how easy it was to do, and I’m interested to see where else I can use Microsoft Flow.

DAX Error: The Expression Refers to Multiple Columns. Multiple Columns Cannot Be Converted to a Scalar Value.

Promotion: Use code DAXERROR to save 10% off my course. Module 1 is free.

Sometimes, when working with DAX, you might get the following error:

The expression refers to multiple columns. Multiple columns cannot be converted to a scalar value.

This error occurs whenever the DAX engine was expecting a single value, or scalar, and instead received a table of values instead. This is an easy error to make because many DAX functions, such as FILTER, SUMMARIZE and ALL, return table values. There are three situations where this error commonly occurs:

  1. Assigning a table value to a measure or calculated column
  2. Forgetting to use a DAX aggregation
  3. Treating ALL or FILTER as an action, not a function

In the rest of the post, we’ll cover each scenario and how to fix it.

Assigning a table value to a measure or calculated column

Let’s say that you were doing some analysis on the products table in the AdventureWorks sample database. In this case, maybe you want to only look at the black products. So you create a measure with the following code:

BlackProducts = FILTER(Products, Products[Color] = “Black”)

image

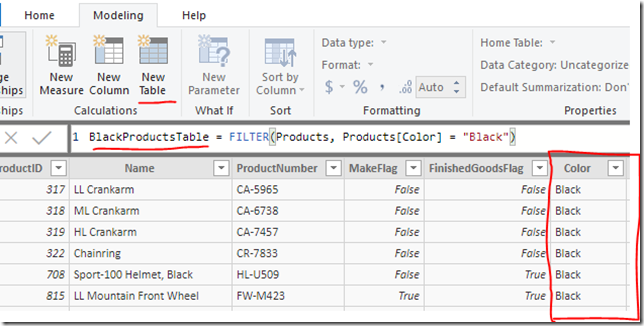
One solution to this problem is instead of assigning the code to a measure, which is intended to display a single value, you can create a calculated table instead.

To do so, go to Modeling –> New table in Power BI Desktop. Then ender the same code as before but for the calculated table. Now you will see a table filtered accordingly.
image

Forgetting to use a DAX aggregation

Now, what if we actually did want a single value instead of a table? Let’s say we want to count the number of black products. In that case, we could wrap our code in an aggregation function, such as COUNTROWS which can take in a table and return a single value.

CountOfBlackProducts = COUNTROWS(FILTER(Products, Products[Color] = “Black”))

This code will return the count of all products, but only if they have black as the color.

Treating ALL or FILTER as an action, not a function

Sometimes, people will try to use functions like ALL or FILTER to filter information on the report. By themselves, these functions actually return a table. However, when they are used with CALCULATE and CALCULATETABLE then you can use them to filter your data appropriately.

Want to learn more?

If you want to learn more about DAX, then check out my free learning path and my paid Pluralsight course.

Fumbling in the Dark with DevOps and Automation

In the past, I’ve been skeptical about how much things like PowerShell, Devops and Docker are relevant to me personally. It makes sense if you are writing application code. It makes sense if you are managing hundreds of servers.

But I do Business Intelligence. How do you write unit tests for a report? Why do I need PowerShell when I can just hit Publish on Power BI Desktop? Do I really need Powershell if I manage 3 SQL Servers?

This year, however, there have been a number of events that have been slowly changing my mind:

I don’t know what I’m doing

I’ve talked before about how automation is a relative term. But I’d like to do some true automation, I’d like to make a script like Cody’s where I can spin up a multi-server homelab with SQL Server, Sample databases and client tools all installed.

And right now I have no idea what I’m Doing and I’m fumbling in the dark. I’ve made a github project and I’ve gotten Lability to create the virtual machines. I know I need to learn Desired State Configuration, and I can’t quite get it to work with Lability yet.

And beyond that, I have no idea what I’m doing. And that’s okay. I suspect that this is a pain a lot of people run into with devops and why they put it off. The reason I write this is to remind people is that it’s okay to suck at something.

Image result for adventure time suck

I’ll keep y’all updated as I slowly make progress, fumbling in the dark.

DAX error: A function ‘XXXX’ has been used in a True/False expression that is used as a table filter expression. This is not allowed.

Promotion: Use code DAXERROR  to save 10% off my course. Module 1 is free.

Whenever you start trying to use more complicated filters in the CALCULATE or CALCULATETABLE functions in DAX, you may start to get the following error:

A function 'MAX' has been used in a True/False expression that is used as a table filter expression. This is not allowed.

image

The function in single quotes may vary. Instead of MAX, it could be SUM, MIN, AVERAGE or nearly anything. Sometimes, you may not even be using a function and the error will just say CALCULATE is the problem:

A function 'CALCULATE' has been used in a True/False expression that is used as a table filter expression. This is not allowed.

image

What causes this error?

The error is caused by using a TRUE/FALSE expression, something that evaluates to TRUE or FALSE, to filter the table in a way that CALCULATE or CALCULATETABLE doesn’t support.  So the error is saying you can’t use a boolean comparison to filter your table except in very specific circumstances.

The following comparisons are not supported:

    1. Comparing to a column to a measure. SalesHeader[TerritoryID] = [LargestTerritory]
    2. Comparing a column to a an aggregate value. SalesHeader[TerritoryID] = MAX(TerritoryID[TerritoryID]])
    3. Comparing a column to a What-If parameter. SalesHeader[TerritoryID] =

TerritoryParameter[TerritoryParameter Value]

In fact, you only have three options if you want to filter a column in a CALCULATE/CALCULATETABLE function:

  1. Compare the column to a static value. SalesHeader[TerritoryID] = 6
  2. Use variables to create a static value. VAR LargestTerritory = MAX(SalesHeader[TerritoryID])
  3. Use a FILTER function instead of a true/false expression. FILTER(SalesHeader, SalesHeader[TerritoryID] = [LargestTerritory])

This is because CALCULATE was designed for safety and performance. Complex row based comparisons can dramatically affect performance. So, in order to do more complex comparisons, you have to take the safety feature off and use the FILTER function.

How do I fix it?

In order to fix the issue, wrap your expression in the FILTER function. To use the FILTER function, you need to pass in the table you want to filter, and then a TRUE/FALSE expression to determine which rows get return. So, let’s say we had the following code:

CALCULATE (
    SUM ( SalesHeader[TotalDue] ),
    SalesHeader[TerritoryID] = [LargestTerritory]
)

to use the FILTER function, we would use this:

CALCULATE (
    SUM ( SalesHeader[TotalDue] ),
    FILTER ( ALL ( SalesHeader[TerritoryID] ), SalesHeader[TerritoryID] =    [LargestTerritory] )
)

The ALL function isn’t strictly necessary, but normally when we filter a single column in a CALCULATE function, it will undo any existing filters on that column. We use ALL here to replicate that behavior. In order to understand the specifics better, check out this article at sqlbi.com

Getting Kubernetes and Containers to “click” for me

Today I had the pleasure of co-hosting the GroupBy Conference. Part of that involved co-hosting as Anthony Nocentino present on Kubernetes. His talk was based on his Pluralsight video on the same topic. After watching his presentation, Kubernetes finally clicked for me. I think I get it.

Before you can get what Kubernetes is about, you need to understand one layer lower and get what containers are about. Aaron Nelson has written a great article on setting up SQL in containers in 5 lines of code. This helped me see how quick and easy it is to spin up a container. Additionally, I see how useful it is to be able to set up a container, kill it and spin up a new one, all in a matter of seconds.

Once you start playing around with containers, you realize you need some way to control and organize them. If you are going to treat them like cattle, not pets, then you need to higher a cattle wrangler. Kubernetes is that cattle wrangler. Or should I call it a kattle wrangler?

I wrote last week about how The Phoenix Project totally altered the way I think about work. It also altered the way I think about deployments and devops. To go fast, to make 10 deploys per day, you need to remove humans as much as possible. You need infrastructure as code. Kubernetes turns your datacenter into code.

I still have some reservations about SQL Server Big Data edition, and I have to wonder when Kubernetes is overkill. But when you need to do dozens of deployments, or blue-green deployments, or implement stateless microservices, it’s a total no-brainer.

T-SQL Tuesday #113: A year of marriage and boardgames

T-SQL Tuesday Logo

This week’s T-SQL Tuesday is about where you use databases in your personal life. And I have a database I don’t use any more that’s a little happy and a little sad. For the first year of my marriage, I would track every time we played a board game together.

image

Of course, some may question if it was really a database. We kept the data in Google Sheets. It was ugly data; if we played multiple games in a day, I didn’t always put in all the dates. I didn’t always spell games the same way. I had different entries for which configuration of Star Realms we played, even though it was the same game.

image

One thing that was really useful was seeing which games Annie kicked my butt at. Or to see which games we played the most. Magic the gathering is in there twice because I did’t always spell it the same way.

image

After a while, we didn’t play quite as frequently and all the data entry started to wear on me. I even played around with making a PowerApp to make it easier.

image

In the end though, I stopped keeping track. Maybe at some point I’ll start again. I find it strangely satisfying to have this bizarre log of the first year of my marriage. During that time, we played about 90 distinct games about 220 times. We had a lot of fun and still dedicate 9 PM to 10 PM as our date hour, but will watch movies or play video games too now. And ultimately, we started what has been the best decision of my life, which was getting married.

Lessons learned from being self-employed, 6 months in.

silhouette of a person sitting in front of a laptop

Back in December, I wrote about all of the hard lessons I was learning by working for myself. Three months later, many of those challenges have shifted, which warrants a new blog post on the subject. In general, I’ll try not to repeat points from the last post.

So let’s assume that you’ve been working for yourself for 6 months. It’s at this point that one of three things has occurred. 1) You’ve burned up all of your savings and need to go back to a normal job, 2) you are getting enough work to make this sustainable, or 3) you are muddling your way through, making enough to pay the bills, but not enough to be happy.

If you have burned all of your savings it is painful, but you learned something valuable and have clear next steps, i.e. get a job. Consider this like a European gap year. Now you know this isn’t for you.

The barely sustainable path is more dangerous because you might shamble along for 5 years, unhappy and not growing, but too scared to give up your dream. Now is the time to make that hard choice. Step it up or quit.  Don’t wait until 60 months in to decide.

Let’s assume instead that you are doing well, really well. Perhaps too well, even. If you are getting plenty of work, then there are new and very important questions to answer. How do you define work and how do you manage it? How do you decide to “release” work into your enterprise? When do you say no?

If you cannot define, manage and prioritize work within your one-person organization, you will overcommit, incorrectly prioritize and eventually fail. It is as simple as that.  I have been eating a lot of humble pie this month as I’ve had to delay or cancel projects. This is because I planned poorly and overcommitted.

What is different?

So how is work any different than a normal job, and why do we need a better handle on it? So the very first thing is that in a regular job, the work is often more consistent or steady-state. In most cases, the variation in requests each week isn’t huge and so you can predict your overall workload. That workload may be more than you can handle, but you can still predict it.

Spikey workloads

Freelance work, in contrast, is extremely spikey. It’s often called “feast or famine”. There are a number of reasons for this. One is that often you’ll land a big project and the customer wants you to work on it RIGHT NOW. I’m wrapping up a 120 hour Power BI project, and the customer’s ideal would have been for me to complete it all in three weeks. My ideal would be to spread it over 12 weeks. The reality lands somewhere in the middle.

Another reason the work is so spikey is the very long lead times on the sales cycle. Some projects can take 3-6 months from first conversation to the contract being signed. By the time the sale closes, you may have already signed up for other commitments. Even worse, guess when you will have the most time to focus on sales? When your funnel is empty. So you get this ugly sine wave of working a ton on sales, then landing a bunch of work and being too busy to work on sales. Then the cycle repeats.

One other reason for the spikiness is if you are a freelancer, you are likely working alone at first. Which means you can’t take emergency work or that 120 hour project and spread it around as easily.

You control your workload

At my last job, I had very little control over what work got “released” or “approved”. I could prioritize and order my tasks, but I wasn’t the one coming up with them. The bulk of my work was based on requests from customers either internal (co-workers) or external.

As a freelancer, you have the power of saying no. You can fire customers. You may not be in a financial position to do it just yet, but that is one of the goals. Paul Jarvis describes it as being able to have a diva list. You control the conditions of your work.

This is especially true when it comes to non-billable work.Nobody wants to turn away paid work, but it’s totally on you if you decide to sign up to write a book, or start blogging every week, or present to more user groups. And because your workload is so spikey, you may sign up for these things when your workload is in a trough and regret it when work picks up. Which is…exactly the trap I fell into.

Your work is less visible

If I present at a user group, is that work? If I chat with people on Twitter, is that work? If I read a book about marketing, is that work? The answer to all of those is a distinct maybe, it depends. If they are work, then they take up time and they need to be monitored. Otherwise you’ll end up wondering why you aren’t spending more time on paid work.

One of the “click” moments for me was when I mapped out all of my non-billable commitments I had made. On an ideal week, I am spending a FULL DAY of work on things that don’t get me paid. Well, at least not directly. Secretly I hope that you’ll start reading my newsletter, fall in love with me, and watch my paid Pluralsight courses.

image

This was not a problem at my last job, because I had a standard set of hours that I worked, and when I went home it was my time. Anything I did extra, like blogging, was icing on the cake. Now it’s a lot blurrier. I treat things like blogging or my newsletter as marketing expenses. I consider those things to be “work” and I track my time in Toggl accordingly.

Which reminds me! Are you tracking your time? If not start now. Toggl.com is completely free and has a simple app too. We manage what we measure. Nobody says you have to work 40 hours per week, but you need to make your work visible to you so that it can be managed and controlled.

What can we do?

So, I’ve been wrestling with these issues a lot. Going freelance reminds me of the Foundation series by Isaac Asimov, where a society faces a life threatening crisis, resolves it and then faces a completely different crisis. Managing work is my current crisis. There are two books that I can recommend that have been foundational (no pun intended) for how I relate to work.

Getting Things Done

The first book, which has transformed my work for the past 8 years, is Getting Things Done by David Allen. There is a lot to this book, but it’s all quite practical stuff. It’s the sort of thing that you’ could have invented yourself with enough time and effort. One of the key insights is that David breaks work into 3 main buckets:

  1. Pre-defined work
  2. Work as it appears
  3. Defining your work

Realizing that it’s valuable to spend time predefining your work, giving it a shape, and making it actionable, these are all amazing insights. GTD helps us turn a nebulous cloud of “work” into manageable, actionable tasks.

What is does not do, however, is provide a lot of guidance on managing the capacity, flow and priorities of our work. While it touches on looking at higher level goals, it treats work as a giant refined todo list, filtered by specific contexts. There is nothing in it that says “Hey, maybe don’t sign up to write a book because you might get busy.” For that, our next book comes in to play.

The Phoenix Project

Until very recently, I have never understood Devops. I got the general idea of unit testing, CI/CD and so on. But I never grokked Devops, to understand it in my bones. The Phoenix Project changed all of that , and it changed how I relate to work. Minor spoilers ahead.

In The Phoenix Project, work is defined in 4 different buckets:

  1. Business projects. Projects that add value to the bottom line.
  2. Internal projects. Projects that improve stability and efficiency.
  3. Changes. Sources of risk introduced by the two above.
  4. Unplanned work. Break/fix type work.

This ties in to the idea of the billable/nonbillable distinction I spoke about easier, as well as making work visible. As a freelancer, you are a “factory” of one, and you have to understand what commitments, internal and external, that you’ve taken on.

After reading the book, I felt utterly embarrassed, like some plant manager who was drunk on the job releasing work willy-nilly. What I learned from this book is that work in progress is the silent killer of productivity and I was producing tons of it.

Another insight from the book is to ask what are your work centers, a la the theory of constraints. What constrains the types of work you can do and when? In GTD, those constraints are largely physical and contextual: phone, email, computer, office, etc.

But in applying the theory to my own life, I realized a lot of my constraints are brain power and energy. Often I was doing brain-less work, like my newsletter when I was at peak energy, instead of doing my more intensive work, like writing courses. It was revelatory to see the constraints and “work centers” in my own factory of one.

One of the steps that I took to address this was to start capacity planning. I looked at my hours in Toggl, and looked at how much of that time was billable. Then I mapped out the total hours for my current commitments, then divided by the previous number. This helped me assess how many weeks of backlog I had at the time.

Summary

As a freelancer, you have much more control over what work you do or don’t do. But, the definitions for what counts as work get hazier and less visible. You need to take time to resolve that fact, as well as looking at your capacity in whole and over the long term.

I personally still haven’t gotten the hang of this. I look forward to your thoughts and book recommendations in the comments below.

Parameters not yet supported in Power BI Aggregations

At the time of this writing, Power BI Aggregations are still in preview and actively being worked on.  Once they leave preview, I expect this issue will either be fixed, or the limitations will be specified in the documentation, just like with DirectQuery in general.

Currently whenever I try to use a what-if parameter or a disconnected parameter table, Power BI Aggregations don’t work as intended, instead it reverts to Direct Query. Which means if I need to use a parameter of some sort, I can’t get the benefit of using aggregations.

UPDATE: This issue seems to depend on where they are being used. Reza Rad identified that the issue does not occur in an if statement.

UPDATE 2: According to Microsoft, this is intended behavior because the parameters aren’t in the pre-aggregations or the mappings. I’ve created a uservoice ticket for this.

Setup

To reproduce this issue, I’ve made an extremely simple data model based AdventureWorks2014 data. There are 4 tables involved with no direct relationships:

  1. SalesHeader, which is my fact table, stored in directquery mode.
  2. SalesHeaderAgg, which is my aggregation table, stored in import mode.
  3. TerritoryParameter, which is a What If Parameter, generated with DAX
  4. Territory, which is a disconnected table, stored in dual mode.

image

I’ve mapped all the columns from my aggregations table to my detail table. In theory, all DAX queries that don’t require a count on CustomerID or TerritoryID, should hit the aggregation table.

image

To start with, I have a table summing TotalDue by Customer.

image

I’ve connected profiler to the SSAS instance that Power BI Desktop runs in the background. This allows us to see what is bring run behind the scenes and if it is hitting the aggregation table.

In this case, Power BI Desktop is doing a TOPN:

EVALUATE
TOPN (
502,
SUMMARIZECOLUMNS (
ROLLUPADDISSUBTOTAL ( ‘SalesHeader'[CustomerID], “IsGrandTotalRowTotal” ),
“SumTotalDue”, CALCULATE ( SUM ( ‘SalesHeader'[TotalDue] ) )
),
[IsGrandTotalRowTotal], 0,
‘SalesHeader'[CustomerID], 1
)
ORDER BY
[IsGrandTotalRowTotal] DESC,
‘SalesHeader'[CustomerID]

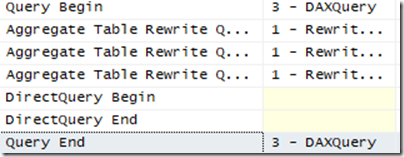
And looking at the events, we can see a successful query rewrite, with no DirectQuery events. everything looks good.

image

The problem

Instead of using an implicit measure, let’s use a explicit measure, with a filter based on a parameter field:

Param Total =
CALCULATE (
SUM ( SalesHeader[TotalDue] ),
FILTER (
SalesHeader,
SalesHeader[TerritoryID] = TerritoryParameter[TerritoryParameter Value]
)
)

And at first, everything looks fine. No DirectQuery calls.

image

But, if I select one of the parameter values using a slicer, now it switches to using DirectQuery.

image

So what’s the difference? Well in the second DAX query, it’s applying the filter via TREATAS

image

What if I use an actual table in dual storage mode and just take the MAX instead?

Param Total =
CALCULATE (
SUM ( SalesHeader[TotalDue] ),
FILTER (
SalesHeader,
SalesHeader[TerritoryID] = MAX ( Territory[TerritoryID] )
)
)

Well, I get the same exact DAX pattern and the same result.

Conclusion

Ultimately, this is one of the tradeoffs of using preview functionality. I’m working with the customer to get a ticket escalated with Microsoft. Ultimately, it may just be an intended limitation of the technology. I hope not, though, because aggregations provide for huge performance improvements with minimal effort.

That being said, if anyone has any ideas, I’m all ears! Below is my proof of concept.

ParametersDemo